

Mathematics, 23.06.2021 02:10, eddrekas8564
Complete each of the following tasks, reading the directions carefully as you go. Be sure to show all work where indicated, including inserting images of graphs. Be sure that all graphs or screenshots include appropriate information such as titles, labeled axes, etc. If your word processing program has an equation editor, you can insert your equations here. Otherwise, print this activity sheet and write your answers by hand.
In addition to the answers you determine, you will be graded based on the work you show, or your solution process. So, be sure to show all your work and answer each question as you complete the task. Type all your work into this document so you can submit it to your teacher for a grade. You will be given partial credit based on the work you show and the completeness and accuracy of your explanations.
Your teacher will give you further directions about how to submit your work. You may be asked to upload the document, e-mail it to your teacher, or print it and hand in a hard copy.
Now, let’s get started!
Step 1: Collect and organize your data.
Using the Super Survey Simulator, survey 10 students of your choice and gather data. Create an organized representation of your data below.
What do you think the purpose of this survey is? Explain.
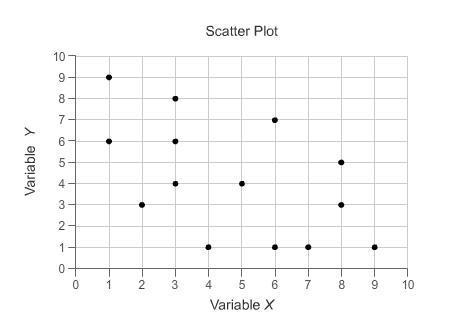
Step 2: Graph your data.
After organizing your data, you will now create a graphical representation of your data.
Why is a scatterplot an appropriate display for this data set?
What features would need to be included on a scatterplot so that the data can be easily analyzed? Make a list of needed features and explain why each is important to the graph.
Next, you will make a scatterplot. Name a point that will be on your scatterplot and describe what it represents.
Using the regression calculator in your tool bar, create a scatterplot using your data set from step 1. Insert a screenshot of your scatterplot, or recreate it below.
Step 3: Analyze your data.
Now that you have represented your data graphically, it can be more easily analyzed.
Describe how the line of best fit and the correlation coefficient can be used to determine the correlation between the two variables on your graph.
Describe the type of correlation between the two variables on your graph. How do you know?
Does the correlation between the variables imply causation? Explain.
How do you calculate the residuals for a scatterplot?
Calculate the residuals for your scatterplot in step 2d.
Create a residual plot for your data.
Does your residual plot show that the linear model from the regression calculator is a good model? Explain your reasoning.
Step 4: Make a prediction with your data.
Using your equation from step 2d, estimate the GPA of a student who studies for 15 hours a week. Justify your answer.

Answers: 1


Other questions on the subject: Mathematics
Mathematics, 21.06.2019 14:30, nunnielangley0
The contents of 3838 cans of coke have a mean of x¯¯¯=12.15x¯=12.15. assume the contents of cans of coke have a normal distribution with standard deviation of σ=0.12.σ=0.12. find the value of the test statistic zz for the claim that the population mean is μ=12.μ=12.
Answers: 1
Mathematics, 21.06.2019 15:30, jasmine0182lopez
Gretchen is setting up for a banquet. she has 300 chairs and needs to distribute them evenly among t tables. how many chairs should she put at each table? write your answer as an expression.
Answers: 1
Mathematics, 21.06.2019 20:00, sanafarghal
Find the value of x. give reasons to justify your solutions! l, m ∈ kn
Answers: 3
Do you know the correct answer?
Complete each of the following tasks, reading the directions carefully as you go. Be sure to show al...
Questions in other subjects:


English, 26.12.2021 03:10
Mathematics, 26.12.2021 03:20

Physics, 26.12.2021 03:20

Social Studies, 26.12.2021 03:20
Mathematics, 26.12.2021 03:20


