

Mathematics, 22.06.2021 21:30, eddiecas
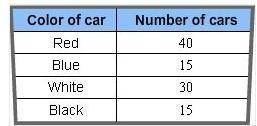
This table reflects the result of a survey conducted in a town to find out the number of cars of a particular color.
Which of the following ranges would be appropriate to use in order to represent the numerical data on the vertical axis of a Bar Graph?
A. 10 to 20
B. 20 to 100
C. 0 to 50
D. 0 to 30

Answers: 3


Other questions on the subject: Mathematics
Mathematics, 21.06.2019 15:50, cluchmasters3831
How many zeros does the function f(x)=4x3-x2+1 have
Answers: 1
Mathematics, 21.06.2019 17:00, afletcher2000
Jasmine wants to eat at 8: 00pm her meal takes 65mins to cook what time does she need to put the meal in the oven
Answers: 2
Mathematics, 21.06.2019 22:30, rivera6681
Solve: 25 points find the fifth term of an increasing geometric progression if the first term is equal to 7−3 √5 and each term (starting with the second) is equal to the difference of the term following it and the term preceding it.
Answers: 1
Do you know the correct answer?
This table reflects the result of a survey conducted in a town to find out the number of cars of a p...
Questions in other subjects:

Biology, 09.07.2019 19:00

Chemistry, 09.07.2019 19:00

Social Studies, 09.07.2019 19:00

Geography, 09.07.2019 19:00


Mathematics, 09.07.2019 19:00


