

Mathematics, 22.06.2021 14:00, OfficallyRobloxedd
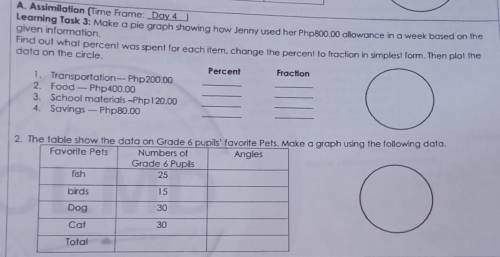
A. Assimilation (Time Frame: Day 4 )
Learning Task 3: Make a pie graph showing how Jenny used her Php800.00 allowance in a week based on the
given information.
Find out what percent was spent for each item, change the percent to fraction in simplest form. Then plot the
data on the circle.
Percent
Fraction
1. Transportation-- Php200.00
2. Food -- Php 400.00
3. School materials -Php120.00
4. Savings - Php 80.00
2. The table show the data on Grade 6 pupils' favorite Pets. Make a graph using the following data.
Favorite Pets
Angles
Numbers of
Grade 6 Pupils
25
fish
birds
15
Dog
30
Cat
30
Total

Answers: 1


Other questions on the subject: Mathematics
Mathematics, 21.06.2019 18:00, madiballet125
What are the equivalent ratios for 24/2= /3= /5.5=108/ = /15
Answers: 1
Mathematics, 21.06.2019 20:00, stichgotrich7159
Michael is training for a marathon. in his first week he plans to run 8miles. what path should he take
Answers: 1
Mathematics, 21.06.2019 20:30, adityamahesh2002
In the diagram of circle o, what is the measure of zabc?
Answers: 2
Do you know the correct answer?
A. Assimilation (Time Frame: Day 4 )
Learning Task 3: Make a pie graph showing how Jenny used her P...
Questions in other subjects:


Mathematics, 06.04.2020 18:45

Mathematics, 06.04.2020 18:45


