

Mathematics, 20.06.2021 03:50, drma1084
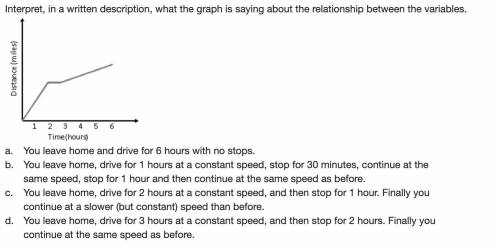
Interpret, in a written description, what the graph is saying about the relationship between the variables.
A graph has time (hours) on the x-axis, and distance (miles) on the y-axis. A line increases to 2 hours, is constant through 3 hours, and then increases through 6 hours.
a.
You leave home and drive for 6 hours with no stops.
b.
You leave home, drive for 1 hours at a constant speed, stop for 30 minutes, continue at the same speed, stop for 1 hour and then continue at the same speed as before.
c.
You leave home, drive for 2 hours at a constant speed, and then stop for 1 hour. Finally you continue at a slower (but constant) speed than before.
d.
You leave home, drive for 3 hours at a constant speed, and then stop for 2 hours. Finally you continue at the same speed as before.

Answers: 2


Other questions on the subject: Mathematics
Mathematics, 21.06.2019 17:00, sciencecreation87
Two planes leave an airport at the same time, one flying east, the other flying west. the eastbound plane travels 20 mph slower. they are 1600 mi apart after 2 hr. find the speed of each plane.
Answers: 1
Mathematics, 21.06.2019 22:30, 20alondra04
Explain how you could use the interactive table to tell if sets of points are on the same line. math 8
Answers: 2
Mathematics, 21.06.2019 22:30, cramirezorozco392
Whit h equation best represents this situation the number 98 increased by an unknown number equal to 120
Answers: 1
Do you know the correct answer?
Interpret, in a written description, what the graph is saying about the relationship between the var...
Questions in other subjects:

Social Studies, 08.12.2021 20:40


Computers and Technology, 08.12.2021 20:40

Biology, 08.12.2021 20:40
Mathematics, 08.12.2021 20:40
Social Studies, 08.12.2021 20:40
Social Studies, 08.12.2021 20:40

Arts, 08.12.2021 20:40


