


Which of the following functions best describes this graph?
A. y = x2-8x +15
B. y = x2 -5x+6<...

Mathematics, 17.06.2021 01:00, kaseyvn03
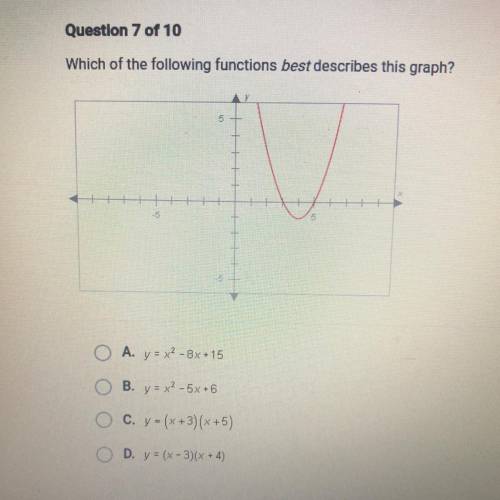
Which of the following functions best describes this graph?
A. y = x2-8x +15
B. y = x2 -5x+6
C. y = (x+3)(x+5)
D. y = (x - 3)(x + 4)

Answers: 1
Other questions on the subject: Mathematics
Mathematics, 21.06.2019 18:30, gabrielaaaa1323
At the olympic games, many events have several rounds of competition. one of these events is the men's 100-meter backstroke. the upper dot plot shows the times (in seconds) of the top 8 finishers in the final round of the 2012 olympics. the lower dot plot shows the times of the same 8 swimmers, but in the semifinal round. which pieces of information can be gathered from these dot plots? (remember that lower swim times are faster.) choose all answers that apply: a: the swimmers had faster times on average in the final round. b: the times in the final round vary noticeably more than the times in the semifinal round. c: none of the above.
Answers: 2
Mathematics, 21.06.2019 18:30, amylumey2005
What can each term of the equation be multiplied by to eliminate the fractions before solving? x – + 2x = + x 2 6 10 12
Answers: 2
Mathematics, 21.06.2019 22:00, rhineharttori
Here is my question! jayne is studying urban planning and finds that her town is decreasing in population by 3% each year. the population of her town is changing by a constant rate. true or false?
Answers: 2
Do you know the correct answer?
Questions in other subjects:
Mathematics, 01.01.2020 11:31

History, 01.01.2020 11:31
Mathematics, 01.01.2020 11:31

Mathematics, 01.01.2020 11:31


