

Mathematics, 16.06.2021 22:40, punkinrichard1oxon2i
Percentage of population supplied by water supply industry
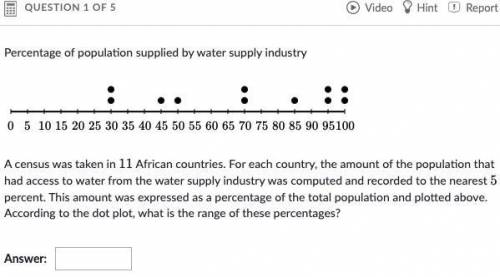
This image is a dot plot. The tick marks begin at 0% and go to 100% in increments of 5 percentage points. There are two dots at 30%, one dot at 45%, one dot at 50%, two dots at 70%, one dot at 85%, two dots at 95%, and two dots at 100%.
This image is a dot plot. The tick marks begin at 0% and go to 100% in increments of 5 percentage points. There are two dots at 30%, one dot at 45%, one dot at 50%, two dots at 70%, one dot at 85%, two dots at 95%, and two dots at 100%.
A census was taken in 11 African countries. For each country, the amount of the population that had access to water from the water supply industry was computed and recorded to the nearest 5 percent. This amount was expressed as a percentage of the total population and plotted above. According to the dot plot, what is the range of these percentages?

Answers: 3


Other questions on the subject: Mathematics
Mathematics, 21.06.2019 18:00, kcarstensen59070
Question: a) does the given set of points represent a linear function? how do you know? b) assume that the point (-2,4) lies on the graph of a line. what y-values could complete this set of ordered pairs that lie on the same line: (- (hint: there are several correct answ
Answers: 2
Do you know the correct answer?
Percentage of population supplied by water supply industry
This image is a dot plot. The tick marks...
Questions in other subjects:


Social Studies, 19.10.2019 07:30

Mathematics, 19.10.2019 07:30

History, 19.10.2019 07:30
English, 19.10.2019 07:30

Chemistry, 19.10.2019 07:30


