

Mathematics, 14.06.2021 20:20, Isaiahplater27
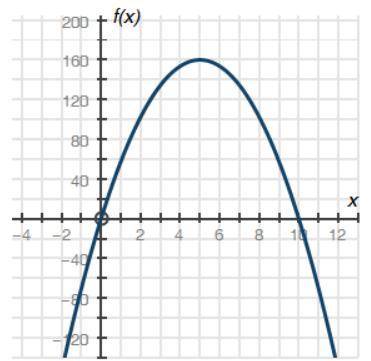
The graph below shows a company's profit f(x), in dollars, depending on the price of pencils x, in dollars, sold by the company:
Graph of quadratic function f of x having x intercepts at ordered pairs negative 0, 0 and 10, 0. The vertex is at 5, 160.
Part A: What do the x-intercepts and maximum value of the graph represent? What are the intervals where the function is increasing and decreasing, and what do they represent about the sale and profit?
Part B: What is an approximate average rate of change of the graph from x = 2 to x = 5, and what does this rate represent?
Part C: Describe the constraints of the domain.

Answers: 3


Other questions on the subject: Mathematics
Mathematics, 21.06.2019 16:00, ashleyd9243
What is the standard deviation of the following data set rounded to the nearest tenth? 3, 17, 18, 15, 12, 21, 9
Answers: 2
Do you know the correct answer?
The graph below shows a company's profit f(x), in dollars, depending on the price of pencils x, in d...
Questions in other subjects:


SAT, 24.10.2021 02:30


