

Mathematics, 14.06.2021 18:20, 0Me0
PLEASE HELP AT YOUR EARLIEST CONVINECE CORRECT ANSWER GET BRAINLIEST AND 50 POINTS PLEASE HELP
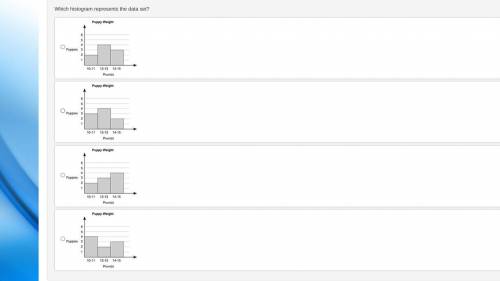
The data set below shows the weights of some puppies, in pounds, at a kennel:
10, 11, 12, 12, 13, 13, 14, 15, 15
Which histogram represents the data set?
A histogram is shown with title Puppy Weight. On the horizontal axis, the title is Pounds. The title on the vertical axis is Puppies. The range on the horizontal axis is 10 to 11, 12 to 13, and 14 to 15. The values on the vertical axis are from 0 to 6 at intervals of 1. The bar for the first range goes to 2, the bar for the second range goes to 4, the bar for the third range goes to 3.
A histogram is shown with title Puppy Weight. On the horizontal axis, the title is Pounds. The title on the vertical axis is Puppies. The range on the horizontal axis is 10 to 11, 12 to 13, and 14 to 15. The values on the vertical axis are from 0 to 6 at intervals of 1. The bar for the first range goes to 3, the bar for the second range goes to 4, the bar for the third range goes to 2.
A histogram is shown with title Puppy Weight. On the horizontal axis, the title is Pounds. The title on the vertical axis is Puppies. The range on the horizontal axis is 10 to 11, 12 to 13, and 14 to 15. The values on the vertical axis are from 0 to 6 at intervals of 1. The bar for the first range goes to 2, the bar for the second range goes to 3, the bar for the third range goes to 4.
A histogram is shown with title Puppy Weight. On the horizontal axis, the title is Pounds. The title on the vertical axis is Puppies. The range on the horizontal axis is 10 to 11, 12 to 13, and 14 to 15. The values on the vertical axis are from 0 to 6 at intervals of 1. The bar for the first range goes to 4, the bar for the second range goes to 2, the bar for the third range goes to 3.
I ATTACHED A PICTURE OF THE GRAPH ANSWER CHOICES FOR BETTER UNDERSTANDING
Thank you have a wonderful day :) (dont stress over this just try your hardest)

Answers: 2


Other questions on the subject: Mathematics
Mathematics, 21.06.2019 17:00, daeshawnc14
Jamie went to home depot. she bought 25 bags of soil that cost $9 per bag. she bought 15 pots at $8 each, and she bought 23 bags of pebbles at $15 each. she used a coupon that gave her $5 off for every 100 dollars she spent. how much did jamie pay at the end?
Answers: 1
Mathematics, 21.06.2019 18:30, myohmyohmy
Nick has box brads. he uses 4 brads for the first project. nick let’s b represent the original number of brads and finds that for the second project, the number of brads he uses is 8 more than half the difference of b and 4. write an expression to represent the number of brads he uses for the second project.
Answers: 3
Do you know the correct answer?
PLEASE HELP AT YOUR EARLIEST CONVINECE CORRECT ANSWER GET BRAINLIEST AND 50 POINTS PLEASE HELP
The...
Questions in other subjects:
Mathematics, 11.03.2020 03:09


Mathematics, 11.03.2020 03:09

Chemistry, 11.03.2020 03:09

History, 11.03.2020 03:09


