

Mathematics, 14.06.2021 06:00, goodgirl2800
The scatter plot below shows the relationship between the outside temperature and the number of cups of hot chocolate sold at an event.
HOT CHOCOLATE SALES
120
100
80
Number of Cups Sold
60
40
20
20 40 60 80
Outside Temperature
(degrees Fahrenheit)
Which statement describes the data?
1
There is no association between the outside temperature, in degrees Fahrenheit, and the number of cups of hot chocolate sold.
2
There is a nonlinear association between the outside temperature, in degrees Fahrenheit, and the number of cups of hot chocolate sold
3
There is a positive linear association between the outside temperature, in degrees Fahrenheit, and the number of cups of hot chocolate sold
4
There is a negative linear association between the outside temperature, in degrees Fahrenheit, and the number of cups of hot chocolate sold.
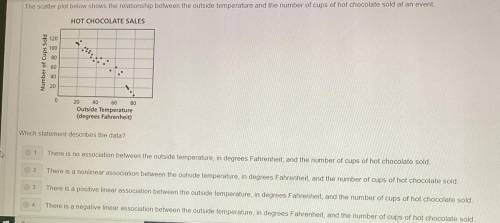

Answers: 3


Other questions on the subject: Mathematics
Mathematics, 21.06.2019 12:50, elviaortiz402373
What is the pattern in the values as the exponents increase?
Answers: 3
Mathematics, 21.06.2019 16:30, maycigrimaldi4990
Problem fathi wants to print out a pdf document that is 48 pages long. to save paper, he decides to print on both sides of each sheet and to print two pages on each side of the sheet. how many sheets of paper will he need?
Answers: 3
Do you know the correct answer?
The scatter plot below shows the relationship between the outside temperature and the number of cups...
Questions in other subjects:

Arts, 25.03.2021 17:00

History, 25.03.2021 17:00
Mathematics, 25.03.2021 17:00
Mathematics, 25.03.2021 17:00
Mathematics, 25.03.2021 17:00
Mathematics, 25.03.2021 17:00


