

Mathematics, 14.06.2021 05:30, glane4907
Hel I'm so failing
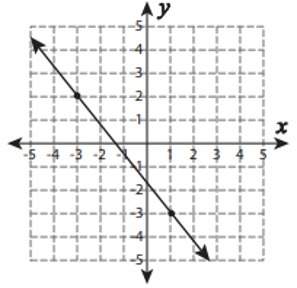
The graph shows the relationship between the number of months different students practiced tennis and the number of matches they won:
The title of the graph is Tennis Matches. On x axis, the label is Number of Months of Practice. On y axis, the label is Number of Matches Won. The scale on the y axis is from 0 to 22 at increments of 2, and the scale on the x axis is from 0 to 12 at increments of 2. The points plotted on the graph are the ordered pairs 0, 2 and 1, 5 and 2, 8 and 3, 9 and 4, 10 and 5, 12 and 6, 13 and 7, 16 and 8,17 and 9, 18 and 10,20. A straight line is drawn joining the ordered pairs 0, 3.3 and 2, 6.8 and 4, 10 and 6, 13.5 and 8, 17 and 10, 20.5.
Part A: What is the approximate y-intercept of the line of best fit and what does it represent? (5 points)
Part B: Write the equation for the line of best fit in the slope-intercept form and use it to predict the number of matches that could be won after 13 months of practice Show your work and include the points used to calculate the slope.

Answers: 1


Other questions on the subject: Mathematics
Mathematics, 20.06.2019 18:02, linshweyioo5442
Write each expression in exponential form and find its value. 3 x 3 x 3
Answers: 1
Mathematics, 21.06.2019 17:30, tatedason33741
Tom wants to order tickets online so that he and three of his friends can go to a water park the cost of the tickets is 16.00 per person there is also a 2.50 one-time service fee for ordering tickets online write an expression in term of n that represents the cost for n ordering tickets online
Answers: 1
Do you know the correct answer?
Hel I'm so failing
The graph shows the relationship between the number of months different students...
Questions in other subjects:
Mathematics, 14.07.2019 03:00
Mathematics, 14.07.2019 03:00


Physics, 14.07.2019 03:00


