

Mathematics, 11.06.2021 04:40, tieragroff
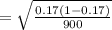
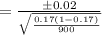
The Food Marketing Institute shows that 17% of households spend more than $100 per week on groceries. Assume the population proportion is p = 0.17 and a sample of 900 households will be selected from the population. Use z-table.
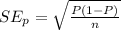
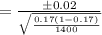
a. Calculate σ(p), the standard error of the proportion of households spending more than $100 per week on groceries (to 4 decimals).
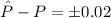
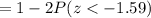
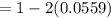
b. What is the probability that the sample proportion will be within +/- 0.02 of the population proportion (to 4 decimals)?
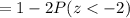
c. What is the probability that the sample proportion will be within +/- 0.02 of the population proportion for a sample of 1,400 households (to 4 decimals)?

Answers: 3


Other questions on the subject: Mathematics
Mathematics, 21.06.2019 21:00, CoolDudeTrist
Construct the graph that models the given situation
Answers: 1
Mathematics, 21.06.2019 22:00, hannahpalmario
The customer price index(cpi), which measures the cost of a typical package of customer goods, was 208.8 in 2011 and 244.1 in 2016.let x=11 corresponding to the year 2011 an estimate to cpi into 2013 and 2014. assume that the data can be modeled by a straight line and the trend to continue idenfinitely. use data points to find such a line and then estimate the requested quantities
Answers: 1
Mathematics, 22.06.2019 01:10, tashatyron24pejls0
|z| > (1/2) {-1/2, 1/2} {z|(-1/2) < z < (1/2)} {z|z < (-1/2) ∪ z > (1/2)}
Answers: 3
Mathematics, 22.06.2019 04:30, angieplasencia8
Kate has 50 quarters and dimes. she has a total of $9.80. how many dimes that she have?
Answers: 1
Do you know the correct answer?
The Food Marketing Institute shows that 17% of households spend more than $100 per week on groceries...
Questions in other subjects:
Mathematics, 27.05.2020 02:07
Mathematics, 27.05.2020 02:07
Mathematics, 27.05.2020 02:07
Mathematics, 27.05.2020 02:07

Mathematics, 27.05.2020 02:07
Mathematics, 27.05.2020 02:07


