

Mathematics, 09.06.2021 23:40, morgantisch25
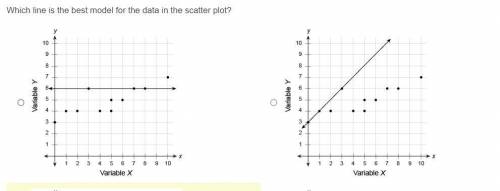
Which line is the best model for the data in the scatter plot?
Coordinate plane in the first quadrant. The x axis is labeled variable X and ranges from 0 to 10 in increments of 1. The y axis is labeled variable Y and ranges from 0 to 10 in increments of 1. The points on the graph are begin ordered pair 0 comma 3 end ordered pair, begin ordered pair 1 comma 4 end ordered pair, begin ordered pair 2 comma 4 end ordered pair, begin ordered pair 3 comma 6 end ordered pair, begin ordered pair 4 comma 4 end ordered pair, begin ordered pair 5 comma 4 end ordered pair, begin ordered pair 5 comma 5 end ordered pair, begin ordered pair 6 comma 5 end ordered pair, begin ordered pair 7 comma 6 end ordered pair, begin ordered pair 8 comma 6 end ordered pair, and begin ordered pair 10 comma 7 end ordered pair. A line is drawn through points begin ordered pair 3 comma 6 end ordered pair, begin ordered pair 7 comma 6 end ordered pair, and begin ordered pair 8 comma 6 end ordered pair.
Coordinate plane in the first quadrant. The x axis is labeled variable X and ranges from 0 to 10 in increments of 1. The y axis is labeled variable Y and ranges from 0 to 10 in increments of 1. The points on the graph are begin ordered pair 0 comma 3 end ordered pair, begin ordered pair 1 comma 4 end ordered pair, begin ordered pair 2 comma 4 end ordered pair, begin ordered pair 3 comma 6 end ordered pair, begin ordered pair 4 comma 4 end ordered pair, begin ordered pair 5 comma 4 end ordered pair, begin ordered pair 5 comma 5 end ordered pair, begin ordered pair 6 comma 5 end ordered pair, begin ordered pair 7 comma 6 end ordered pair, begin ordered pair 8 comma 6 end ordered pair, and begin ordered pair 10 comma 7 end ordered pair. A line is drawn through points begin ordered pair 0 comma 3 end ordered pair, begin ordered pair 1 comma 4 end ordered pair, and begin ordered pair 3 comma 6 end ordered pair.
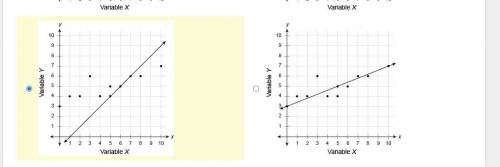
Coordinate plane in the first quadrant. The x axis is labeled variable X and ranges from 0 to 10 in increments of 1. The y axis is labeled variable Y and ranges from 0 to 10 in increments of 1. The points on the graph are begin ordered pair 0 comma 3 end ordered pair, begin ordered pair 1 comma 4 end ordered pair, begin ordered pair 2 comma 4 end ordered pair, begin ordered pair 3 comma 6 end ordered pair, begin ordered pair 4 comma 4 end ordered pair, begin ordered pair 5 comma 4 end ordered pair, begin ordered pair 5 comma 5 end ordered pair, begin ordered pair 6 comma 5 end ordered pair, begin ordered pair 7 comma 6 end ordered pair, begin ordered pair 8 comma 6 end ordered pair, and begin ordered pair 10 comma 7 end ordered pair. A line is drawn through points begin ordered pair 5 comma 4 end ordered pair, begin ordered pair 6 comma 5 end ordered pair, and begin ordered pair 7 comma 6 end ordered pair.
Coordinate plane in the first quadrant. The x axis is labeled variable X and ranges from 0 to 10 in increments of 1. The y axis is labeled variable Y and ranges from 0 to 10 in increments of 1. The points on the graph are begin ordered pair 0 comma 3 end ordered pair, begin ordered pair 1 comma 4 end ordered pair, begin ordered pair 2 comma 4 end ordered pair, begin ordered pair 3 comma 6 end ordered pair, begin ordered pair 4 comma 4 end ordered pair, begin ordered pair 5 comma 4 end ordered pair, begin ordered pair 5 comma 5 end ordered pair, begin ordered pair 6 comma 5 end ordered pair, begin ordered pair 7 comma 6 end ordered pair, begin ordered pair 8 comma 6 end ordered pair, and begin ordered pair 10 comma 7 end ordered pair. A line is drawn through points begin ordered pair 0 comma 3 end ordered pair, begin ordered pair 5 comma 5 end ordered pair, and begin ordered pair 10 comma 7 end ordered pair.

Answers: 2


Other questions on the subject: Mathematics
Mathematics, 21.06.2019 20:30, violetagamez2
Answer for 10 points show work you guys in advanced < 3
Answers: 1
Mathematics, 21.06.2019 22:00, jnkbragg3696
Problem situation: caren is making rice and beans. she can spend no more than $10 on ingredients. she buys one bag of rice for $4.99. beans cost $0.74 per pound. how many pounds of beans, x, can she buy? inequality that represents this situation: 10≥4.99+0.74x drag each number to show if it is a solution to both the inequality and the problem situation, to the inequality only, or if it is not a solution.
Answers: 1
Mathematics, 22.06.2019 03:00, jjgurl60
Ashley spent half of her lunch money on a turkey sandwich. then she spent two-thirds of the money she had left on a bottle of juice and the rest of the money on a cookie. if the cookie cost $.75, how much lunch money did ashley have to start with?
Answers: 2
Do you know the correct answer?
Which line is the best model for the data in the scatter plot?
Coordinate plane in the first quadra...
Questions in other subjects:


Mathematics, 29.07.2020 21:01
Mathematics, 29.07.2020 21:01


