

Mathematics, 09.06.2021 22:20, pr173418
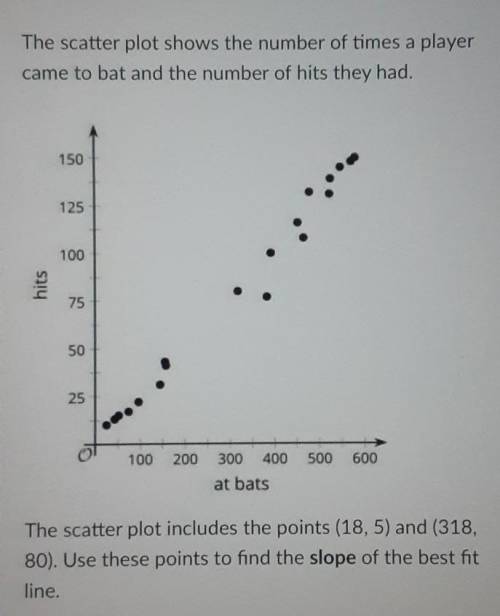
The scatter plot shows the number of times a player came to bat and the number of hits they had.
(see photo I attached)
The scatter plot includes the points (18, 5) and (318, 80). Use these points to find the slope of the best fit line.
Please help, if you answer correctly I'll mark you brainliest, follow you, give you a heart, and rate your answer 5 stars!!

Answers: 1


Other questions on the subject: Mathematics
Mathematics, 22.06.2019 02:00, Peachyyyyyy24
Aiko jumped rope for 20 min and stopped at 8: 05 when did she start
Answers: 1
Mathematics, 22.06.2019 03:30, texas101st78
Find the solution set for this equation: t^2+7t=0 separate the two values with a comma.
Answers: 2
Do you know the correct answer?
The scatter plot shows the number of times a player came to bat and the number of hits they had.
(s...
Questions in other subjects:


Mathematics, 08.12.2019 20:31

Biology, 08.12.2019 20:31

Chemistry, 08.12.2019 20:31
Chemistry, 08.12.2019 20:31


