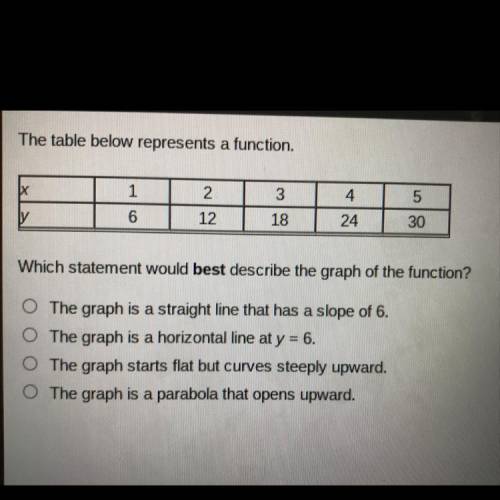
The table below represents a function.
x
1
2
3
4
5
y
6
12
18
24
30
Which statement would best describe the graph of the function?
The graph is a straight line that has a slope of 6.
The graph is a horizontal line at y = 6.
The graph starts flat but curves steeply upward.
The graph is a parabola that opens upward.
Two rectangular prisms have the same volume. the area of the base of the blue prism is 418 4 1 8 square units. the area of the base of the red prism is one-half that of the blue prism. which statement is true?
Line u passes through points (-52, -18) and (-29, 53). line v passes through points (90, 33) and (19, 56). are line u and line v parallel or perpendicular?
The construction of copying qpr is started below. the next step is to set the width of the compass to the length of ab. how does this step ensure that a new angle will be congruent to the original angle? by using compass take the measures of angle and draw the same arc according to it.
The table below shows the number of free throw shots attempted and the number of shots made for the five starting players on the basketball team during practice. each player's goal is to make 80% of her shots.