


A bus is traveling between two cities that
are in neighboring states. The graph of
the functi...

Mathematics, 08.06.2021 14:00, adenmoye0910
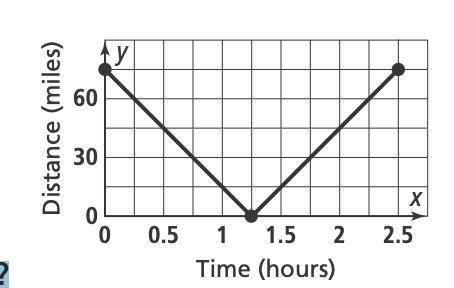
A bus is traveling between two cities that
are in neighboring states. The graph of
the function d(t) = 60|t − 1.25| shows the
distance of the bus in miles from the state line,
where t represents time in hours.
a. What does the graph tell you about the bus ride?
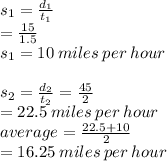
b. What is the average rate of change from 1.5 h to 2 h? What does the
average rate of change represent?

Answers: 2
Other questions on the subject: Mathematics
Mathematics, 21.06.2019 15:30, logan12345677885675
The value √10 and √15 are plotted on the number line
Answers: 2
Do you know the correct answer?
Questions in other subjects:


Business, 31.01.2020 04:45


Social Studies, 31.01.2020 04:45

Mathematics, 31.01.2020 04:45


