


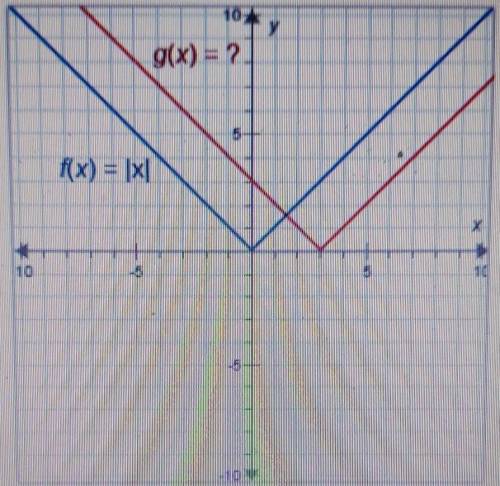
The function f(x) and g(x) are shown on the graph. f(x)=|x|. what is g(x)?
A: g(x) = |x| + 3
B...

Mathematics, 08.06.2021 03:00, boopiee2349
The function f(x) and g(x) are shown on the graph. f(x)=|x|. what is g(x)?
A: g(x) = |x| + 3
B: g(x) = |x| - 3
C: g(x) = |x + 3|
D: g(x) = |x - 3|

Answers: 2
Other questions on the subject: Mathematics
Mathematics, 21.06.2019 16:00, jeff7259
The scatter plot graph shows the average annual income for a certain profession based on the number of years of experience which of the following is most likely to be the equation of the trend line for this set of data? a. i=5350e +37100 b. i=5350e-37100 c. i=5350e d. e=5350e+37100
Answers: 1
Mathematics, 21.06.2019 19:30, amanquen35
The pyramid below was dissected by a horizontal plane which shape describes the pyramid horizontal cross section
Answers: 1
Mathematics, 21.06.2019 20:00, lucerogon7403
How can you construct perpendicular lines and prove theorems about perpendicular lines
Answers: 3
Do you know the correct answer?
Questions in other subjects:


Mathematics, 20.01.2021 23:50


Mathematics, 20.01.2021 23:50
Mathematics, 20.01.2021 23:50


