


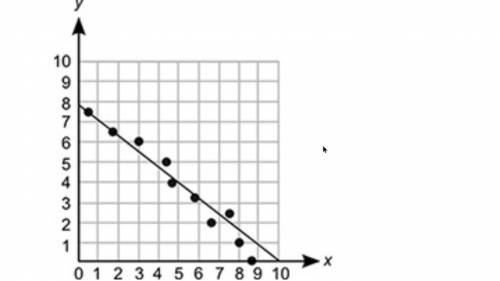
A line is drawn on a scatter plot, as shown below:
(Graph is below answer choices)
Whic...

Mathematics, 07.06.2021 03:10, sarakiker
A line is drawn on a scatter plot, as shown below:
(Graph is below answer choices)
Which statement best describes the line?
A. It cannot be the line of best fit because it is does not show a positive linear relationship.
B. It cannot be the line of best fit because it does not pass through all the data points.
C. It can be the line of best fit because it passes through all the data points.
D. It can be the line of best fit because it closely fits the data points.

Answers: 2
Other questions on the subject: Mathematics
Mathematics, 21.06.2019 17:00, karina1466
What is the value of the expression 9+n/3-6 when n = 12? 1. 5. 7. 12.
Answers: 1
Mathematics, 21.06.2019 19:50, leximae2186
The graph shows the distance kerri drives on a trip. what is kerri's speed?
Answers: 3
Mathematics, 21.06.2019 20:40, brayann5761
What is the value of the expression i 0 × i 1 × i 2 × i 3 × i 4? 1 –1 i –i
Answers: 2
Mathematics, 21.06.2019 23:00, nataliemakin7123
Which rectangle if translated 6 units right and 16 units down and the rotated 90° clockwise about the point (4, -11) will result in rectangle e?
Answers: 2
Do you know the correct answer?
Questions in other subjects:

Mathematics, 02.03.2021 02:30
Physics, 02.03.2021 02:30


Social Studies, 02.03.2021 02:30

Physics, 02.03.2021 02:30

History, 02.03.2021 02:30


