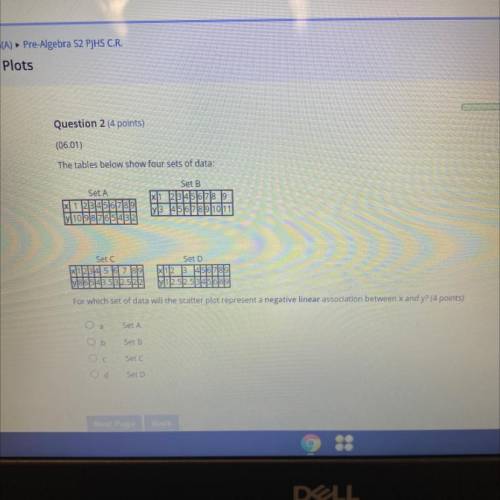
Set A
Step-by-step explanation:
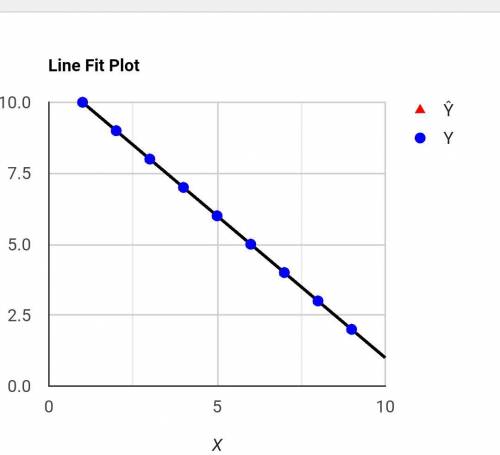
A negative linear association will always have a negative slope , a negative association can also be be detected from the data given, as the y value will decrease as the x values increases or vice versa.
The plot of the set A is attached Below with a correlation of - 1, meaning a strong negative relationship exists between the x and y variables.