


(2,4)

Mathematics, 04.06.2021 20:00, zachcochran2007
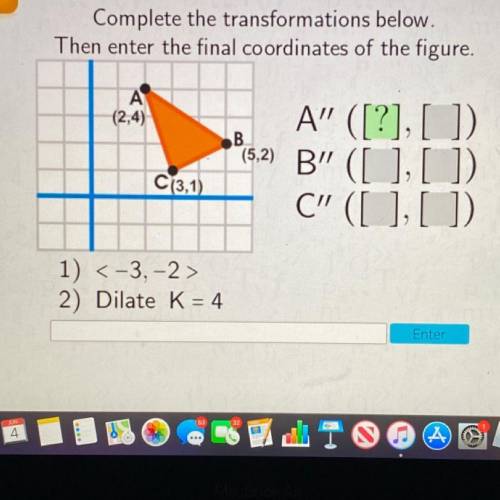
Complete the transformations below.
Then enter the final coordinates of the figure.
(2,4)
B
A” ([?], [])
(5.2) B" ([ ], [])
C" ([ ], [ ])
C(3,1)
1) <-3, -2>
2) Dilate K = 4
Enter
someone please help

Answers: 1
Other questions on the subject: Mathematics
Mathematics, 21.06.2019 15:20, lambobacon9027
Classify the following triangle check all that apply
Answers: 2
Mathematics, 21.06.2019 18:30, daniel1480
Given: m∠ adb = m∠cdb ad ≅ dc prove: m∠ bac = m∠bca lol
Answers: 2
Mathematics, 21.06.2019 23:00, kj44
Each of the following data sets has a mean of x = 10. (i) 8 9 10 11 12 (ii) 7 9 10 11 13 (iii) 7 8 10 12 13 (a) without doing any computations, order the data sets according to increasing value of standard deviations. (i), (iii), (ii) (ii), (i), (iii) (iii), (i), (ii) (iii), (ii), (i) (i), (ii), (iii) (ii), (iii), (i) (b) why do you expect the difference in standard deviations between data sets (i) and (ii) to be greater than the difference in standard deviations between data sets (ii) and (iii)? hint: consider how much the data in the respective sets differ from the mean. the data change between data sets (i) and (ii) increased the squared difference îł(x - x)2 by more than data sets (ii) and (iii). the data change between data sets (ii) and (iii) increased the squared difference îł(x - x)2 by more than data sets (i) and (ii). the data change between data sets (i) and (ii) decreased the squared difference îł(x - x)2 by more than data sets (ii) and (iii). none of the above
Answers: 2
Mathematics, 22.06.2019 01:20, blackboy21
1. why is a frequency distribution useful? it allows researchers to see the "shape" of the data. it tells researchers how often the mean occurs in a set of data. it can visually identify the mean. it ignores outliers. 2. the is defined by its mean and standard deviation alone. normal distribution frequency distribution median distribution marginal distribution 3. approximately % of the data in a given sample falls within three standard deviations of the mean if it is normally distributed. 95 68 34 99 4. a data set is said to be if the mean of the data is greater than the median of the data. normally distributed frequency distributed right-skewed left-skewed
Answers: 2
Do you know the correct answer?
Complete the transformations below.
Then enter the final coordinates of the figure.
(2,4)
(2,4)
Questions in other subjects:


Mathematics, 04.09.2020 19:01


