

Mathematics, 04.06.2021 18:30, Renebebe1
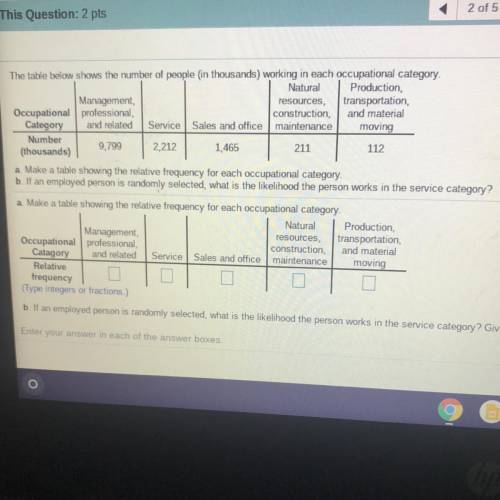
The table below shows the number of people in thousands) working in each occupational category
Natural
Production
Management
resources, transportation,
Occupational professional
construction and material
Category and related Service Sales and office maintenance moving
Number
9.799 2212
1,465
211
(thousands)
112
a Make a table showing the relative frequency for each occupational category.
bt an employed person is randomly selected what is the likelihood the person works in the service category?
a Make a table showing the relative frequency for each occupational category
Natural Production
Management
resources transportation
Occupational professional
construction and material
Category and related Service Sales and office maintenance
moving
Relative
frequency
beyed person s randomly selected what is the likelihood the person works in the service category? Give the answer as a percentage
Echans er boxes

Answers: 2


Other questions on the subject: Mathematics
Mathematics, 21.06.2019 16:00, kell22wolf
Part one: measurements 1. measure your own height and arm span (from finger-tip to finger-tip) in inches. you will likely need some from a parent, guardian, or sibling to get accurate measurements. record your measurements on the "data record" document. use the "data record" to you complete part two of this project. name relationship to student x height in inches y arm span in inches archie dad 72 72 ginelle mom 65 66 sarah sister 64 65 meleah sister 66 3/4 67 rachel sister 53 1/2 53 emily auntie 66 1/2 66 hannah myself 66 1/2 69 part two: representation of data with plots 1. using graphing software of your choice, create a scatter plot of your data. predict the line of best fit, and sketch it on your graph. part three: the line of best fit include your scatter plot and the answers to the following questions in your word processing document 1. 1. which variable did you plot on the x-axis, and which variable did you plot on the y-axis? explain why you assigned the variables in that way. 2. write the equation of the line of best fit using the slope-intercept formula $y = mx + b$. show all your work, including the points used to determine the slope and how the equation was determined. 3. what does the slope of the line represent within the context of your graph? what does the y-intercept represent? 5. use the line of best fit to you to describe the data correlation.
Answers: 2
Mathematics, 21.06.2019 17:00, liddopiink1
Find the area of a parallelogram with the given vertices. p(-2, -5), q(9, -5), r(1, 5), s(12, 5)
Answers: 1
Mathematics, 21.06.2019 17:20, ryleepretty
Two language majors, anna and megan, took exams in two languages. anna scored 85 on both exams. megan scored 74 on the first exam and 85 on the second exam. overall, student scores on the first exam had a mean of 82 and a standard deviation of 4, and the second exam scores had a mean of 71 and a standard deviation of 13. a) to qualify for language honors, a major must maintain at least an 85 average across all language courses taken. so far, which of anna and megan qualify? b) which student's overall performance was better?
Answers: 2
Mathematics, 21.06.2019 18:00, drew3vans34
14. (05.02 lc) what is the value of y in the solution to the following system of equations? (5 points) 2x + y = −4 5x + 3y = −6
Answers: 1
Do you know the correct answer?
The table below shows the number of people in thousands) working in each occupational category
Natu...
Questions in other subjects:
Mathematics, 12.09.2021 06:50

Mathematics, 12.09.2021 06:50

Mathematics, 12.09.2021 06:50


