

Mathematics, 02.06.2021 22:40, boss1373
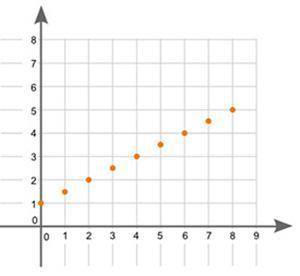
A scatter plot is shown:
A scatter plot is shown. Data points are located at 0 and 1, 1 and 1.5, 2 and 2, 3 and 2.5, 4 and 3, 5 and 3.5, 6 and 4, 7 and 4.5, 8 and 5.
What type of association does the graph show between x and y?

Answers: 3


Other questions on the subject: Mathematics
Mathematics, 21.06.2019 20:20, bbyjoker
Recall that the owner of a local health food store recently started a new ad campaign to attract more business and wants to know if average daily sales have increased. historically average daily sales were approximately $2,700. the upper bound of the 95% range of likely sample means for this one-sided test is approximately $2,843.44. if the owner took a random sample of forty-five days and found that daily average sales were now $2,984, what can she conclude at the 95% confidence level?
Answers: 1
Mathematics, 21.06.2019 23:30, saintsfan2004
Arestaurant added a new outdoor section that was 8 feet wide and 6 feet long. what is the area of their new outdoor section
Answers: 1
Do you know the correct answer?
A scatter plot is shown:
A scatter plot is shown. Data points are located at 0 and 1, 1 and 1.5, 2...
Questions in other subjects:
Mathematics, 26.10.2019 05:43
Mathematics, 26.10.2019 05:43


History, 26.10.2019 05:43

Mathematics, 26.10.2019 05:43

Biology, 26.10.2019 05:43


