

Mathematics, 02.06.2021 17:10, angellinelittle
Project: Data Analysis
I. Collect data from several fast food chains on the number of fat calories and grams of saturated fat in menu items. Record at least 12 ordered pairs of (fat calories, grams of saturated fat). Organize your data in a table.
II. Make a scatter plot of the data on graph paper. Be sure to label the axes and use an appropriate title for the graph.
You may wish to use a graphing calculator, spread sheet, or other technology resource (such as the graphing utility link below) to aid you in graphing.
III. Draw a trend line for the scatter plot. Use the following scatter plot of the ordered pairs (fat grams, total calories) as an example.
IV. Calculate the slope of the trend line. (Choose two points on the line and find vertical change over horizontal change.)
Note: Graphing calculators and spread sheets have features with which to draw trend lines and determine the equation. You may choose to use one of these options. If you use technology, indicate what steps were taken to arrive at your equation.
V. Using the slope and y-intercept, write the equation of the trend line ( y = mx + b).
VI. Choose a "calories from fat" value that is not in your collected data set and that is at least 10 fat calories away from any collected value. Use the equation calculated in step V to predict the number of fat grams in an item having that number of fat calories. Be sure to show your work.
VII. Search for an item in a fast food menu having the same number of fat calories as the one you chose above. (If you cannot find the exact value, get as close as you can.) Compare the calculated value from step VI to this actual value. Explain why (or why not) you would have expected your prediction (calculated value) to be close to the actual value

Answers: 2


Other questions on the subject: Mathematics
Mathematics, 21.06.2019 21:00, cinthyafleitas
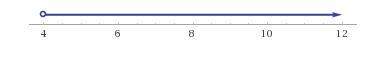
What number line represents the solution set for the inequality -1/2 greater than or equal to 4
Answers: 1
Mathematics, 21.06.2019 23:00, janeou17xn
The equation shown below represents function f. f(x)= -2x+5 the graph shown below represents function g. which of the following statements is true? a. over the interval [2, 4], the average rate of change of f is the same as the average rate of change of g. the y-intercept of function f is less than the y-intercept of function g. b. over the interval [2, 4], the average rate of change of f is greater than the average rate of change of g. the y-intercept of function f is greater than the y-intercept of function g. c. over the interval [2, 4], the average rate of change of f is the same as the average rate of change of g. the y-intercept of function f is greater than the y-intercept of function g. d. over the interval [2, 4], the average rate of change of f is less than the average rate of change of g. the y-intercept of function f is the same as the y-intercept of function g.
Answers: 1
Do you know the correct answer?
Project: Data Analysis
I. Collect data from several fast food chains on the number of fat calories...
Questions in other subjects:


History, 22.04.2020 20:51


Mathematics, 22.04.2020 20:52


