


TRIG HMWRK HELP
i only need help with the graph part (number 7)
...

Mathematics, 28.05.2021 22:00, loraine8401
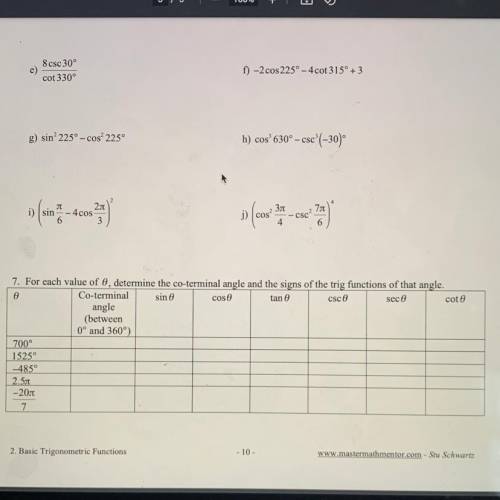
TRIG HMWRK HELP
i only need help with the graph part (number 7)

Answers: 3
Other questions on the subject: Mathematics
Mathematics, 21.06.2019 16:30, ryleepretty
Quadrilateral ghjk has vertices g(2, 3), h(8, 2), j(6, 8), and k(3, 6). it is transformed according to the rule t(–4, –5). what are the coordinates of g”? (–7, 3) (–2, 2) (–1, –7) (2, –2)
Answers: 2
Mathematics, 21.06.2019 17:30, QueenNerdy889
Suppose that an airline uses a seat width of 16.516.5 in. assume men have hip breadths that are normally distributed with a mean of 14.414.4 in. and a standard deviation of 0.90.9 in. complete parts (a) through (c) below. (a) find the probability that if an individual man is randomly selected, his hip breadth will be greater than 16.516.5 in. the probability is nothing. (round to four decimal places as needed.)
Answers: 3
Mathematics, 21.06.2019 20:00, cduke1919
The boiling point of water at an elevation of 0 feet is 212 degrees fahrenheit (°f). for every 1,000 feet of increase in elevation, the boiling point of water decreases by about 2°f. which of the following represents this relationship if b is the boiling point of water at an elevation of e thousand feet? a) e = 2b - 212 b) b = 2e - 212 c) e = -2b + 212 d) b = -2e + 212
Answers: 1
Mathematics, 22.06.2019 01:00, s27511583
The weight of 46 new patients of a clinic from the year 2018 are recorded and listed below. construct a frequency distribution, using 7 classes. then, draw a histogram, a frequency polygon, and an ogive for the data, using the relative information from the frequency table for each of the graphs. describe the shape of the histogram. data set: 130 192 145 97 100 122 210 132 107 95 210 128 193 208 118 196 130 178 187 240 90 126 98 194 115 212 110 225 187 133 220 218 110 104 201 120 183 124 261 270 108 160 203 210 191 180 1) complete the frequency distribution table below (add as many rows as needed): - class limits - class boundaries - midpoint - frequency - cumulative frequency 2) histogram 3) frequency polygon 4) ogive
Answers: 1
Do you know the correct answer?
Questions in other subjects:

History, 29.10.2020 20:10

Computers and Technology, 29.10.2020 20:10


Mathematics, 29.10.2020 20:10
Mathematics, 29.10.2020 20:10


