


extreme values.

Mathematics, 28.05.2021 01:00, orlando19882000
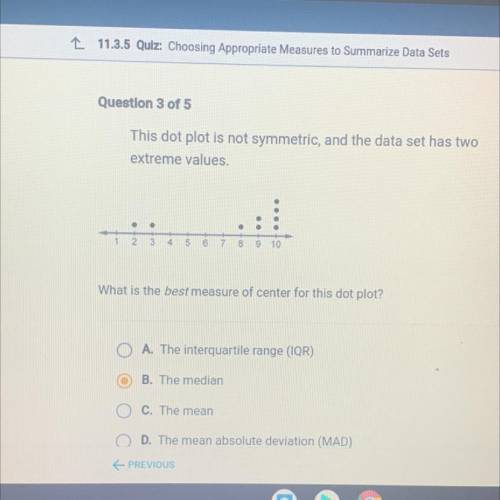
Question 3 of 5
This dot plot is not symmetric, and the data set has two
extreme values.
.
1 2 3 4
5
6
7
8
9
10
What is the best measure of center for this dot plot?
O A. The interquartile range (IQR)
OB. The median
C. The mean
OD. The mean absolute deviation (MAD)
PREVIOUS

Answers: 1
Other questions on the subject: Mathematics
Mathematics, 22.06.2019 00:30, gthif13211
I've been working on this for a few days and i just don't understand, it's due in a few hours. you. the direction of a vector is defined as the angle of the vector in relation to a horizontal line. as a standard, this angle is measured counterclockwise from the positive x-axis. the direction or angle of v in the diagram is α. part a: how can you use trigonometric ratios to calculate the direction α of a general vector v = < x, y> similar to the diagram? part b suppose that vector v lies in quadrant ii, quadrant iii, or quadrant iv. how can you use trigonometric ratios to calculate the direction (i. e., angle) of the vector in each of these quadrants with respect to the positive x-axis? the angle between the vector and the positive x-axis will be greater than 90 degrees in each case. part c now try a numerical problem. what is the direction of the vector w = < -1, 6 > ?
Answers: 1
Mathematics, 22.06.2019 04:30, dwilburn01
Of the total number of spectators at a circus show, 1/4 are men. 2/5 of the remaining number of spectators are women. there are 132 women at the circus show. how many children are at the circus show?
Answers: 2
Do you know the correct answer?
Question 3 of 5
This dot plot is not symmetric, and the data set has two
extreme values.
extreme values.
Questions in other subjects:

History, 12.11.2019 03:31

English, 12.11.2019 03:31
History, 12.11.2019 03:31

Health, 12.11.2019 03:31
History, 12.11.2019 03:31


