

Mathematics, 27.05.2021 18:50, nathanphelps2468
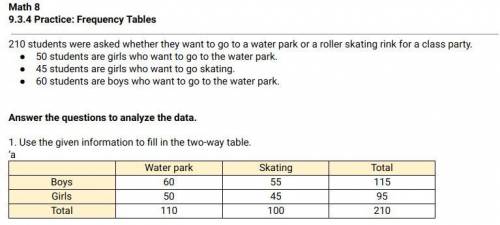
210 students were asked whether they want to go to a water park or a roller skating rink for a class party. 50 students are girls who want to go to the water park. 45 students are girls who want to go skating. 60 students are boys who want to go to the water park. Answer the questions to analyze the data. 1. Use the given information to fill in the two-way table. ‘a Water park Skating Total Boys 60 55 115 Girls 50 45 95 Total 110 100 210 2. How many boys want to go skating? 55 3. To the nearest hundredth, what is the relative frequency of boys who want to go to the water park? 4. The probability that a student is in a category can be approximated by the relative frequency. To the nearest hundredth, what is the probability that a randomly selected student is a girl who wants to go skating? Show how you know. 5. Are there more boy students or girl students? Do you read this information from the joint frequencies or the marginal frequencies? Explain how you know. 6. Which destination is more popular, the skating rink or the water park? Explain how you know.

Answers: 3


Other questions on the subject: Mathematics
Mathematics, 21.06.2019 15:30, hejdiidid9311
Will used 20 colored tiles to make a design in art class. 5/20 of his tiles were red. what is an equivalent fraction for the red tiles?
Answers: 1
Mathematics, 21.06.2019 22:00, prishnasharma34
The two box p digram the two box plots show the data of the pitches thrown by two pitchers throughout the season. which statement is correct? check all that apply. pitcher 1 has a symmetric data set. pitcher 1 does not have a symmetric data set. pitcher 2 has a symmetric data set. pitcher 2 does not have a symmetric data set. pitcher 2 has the greater variation. ots represent the total number of touchdowns two quarterbacks threw in 10 seasons of play
Answers: 1
Do you know the correct answer?
210 students were asked whether they want to go to a water park or a roller skating rink for a class...
Questions in other subjects:
Mathematics, 08.06.2021 03:10


History, 08.06.2021 03:10
History, 08.06.2021 03:10
Mathematics, 08.06.2021 03:10
Mathematics, 08.06.2021 03:10
Mathematics, 08.06.2021 03:10
Mathematics, 08.06.2021 03:10


