

Mathematics, 26.05.2021 01:00, ben2005
While at her family reunion, Anaya surveys the people there and makes a list
of everyone's ages. She wants to make a data display that shows the
youngest age, the mean age, and the oldest age, along with the way the other
ages are distributed. What kind of display is her best choice?
A. Histogram
B. Line graph
C. Ogive
D. Box-and-whisker plot

Answers: 3
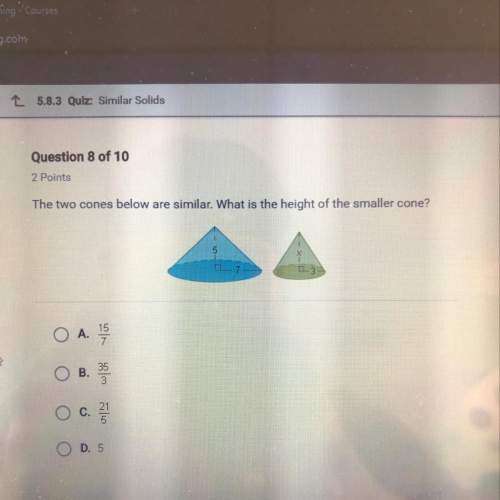


Other questions on the subject: Mathematics
Mathematics, 21.06.2019 15:30, jakobrobinette
In δabc, if the length of side b is 3 centimeters and the measures of ∠b and ∠c are 45° and 60°, respectively, what is the length of side c to two decimal places?
Answers: 1
Mathematics, 22.06.2019 00:30, hannahpalacios101
36x2 + 49y2 = 1,764 the foci are located at: a) (-√13, 0) and (√13,0) b) (0, -√13) and (0,√13) c) (-1, 0) and (1, 0)
Answers: 1
Mathematics, 22.06.2019 02:30, jujurocks10
Which problem would you use the following proportion to solve for? 24/x = 40/100 a. what is 40% of 24? b. what percent is 24 of 40? c. twenty-four is 40% of what number? d. forty percent of 24 is what number?
Answers: 1
Mathematics, 22.06.2019 03:00, deshundradenton59
Factor the gcf out of the polynomial 9x^6+6x^4+15x^3
Answers: 1
Do you know the correct answer?
While at her family reunion, Anaya surveys the people there and makes a list
of everyone's ages. Sh...
Questions in other subjects:
Mathematics, 31.01.2020 01:43
Mathematics, 31.01.2020 01:43
Mathematics, 31.01.2020 01:43

Social Studies, 31.01.2020 01:43


History, 31.01.2020 01:43

Biology, 31.01.2020 01:44
History, 31.01.2020 01:44


