Mathematics
Mathematics, 23.05.2021 20:50, Elepeodowke

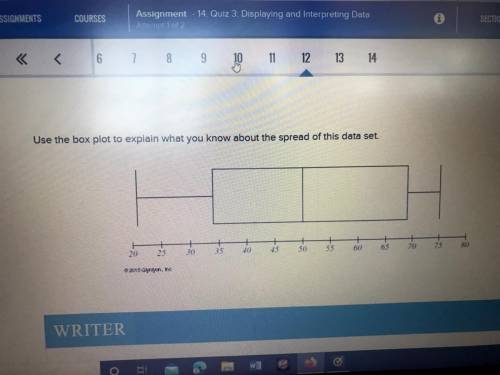
Use the box plot to explain what you know about the spread of this data set. 25
20
30
35
40
45
50
SS
60
65
70
75
80

M


Use the box plot to explain what you know about the spread of this data set.

25
20
30
35
40
45
50

answer
Answers: 1

Other questions on the subject: Mathematics

image
Mathematics, 21.06.2019 15:30, davidaagurto
Jordan rides his bike 6 7/15 miles every day to deliver newspapers and to go to and from school. if his ride to and from school is 4 3/10 miles, how many miles is the trip to deliver newspapers? 1 1/3 1 1/6 2 1/6 2 4/5
Answers: 1
image
Mathematics, 21.06.2019 20:30, anniekwilbourne
Kayla made observations about the sellin price of a new brand of coffee that sold in the three different sized bags she recorded those observations in the following table 6 is $2.10 8 is $2.80 and 16 is to $5.60 use the relationship to predict the cost of a 20oz bag of coffee.
Answers: 3
image
Mathematics, 21.06.2019 21:10, mauricio18s
Determine the solution for mc001-1.jpeg
Answers: 1
image
Mathematics, 21.06.2019 23:10, jaylenmiller437
Astudent draws two parabolas on graph paper. both parabolas cross the x-axis at (–4, 0) and (6, 0). the y-intercept of the first parabola is (0, –12). the y-intercept of the second parabola is (0, –24). what is the positive difference between the a values for the two functions that describe the parabolas? write your answer as a decimal rounded to the nearest tenth
Answers: 2