

Mathematics, 22.05.2021 21:00, 201010399
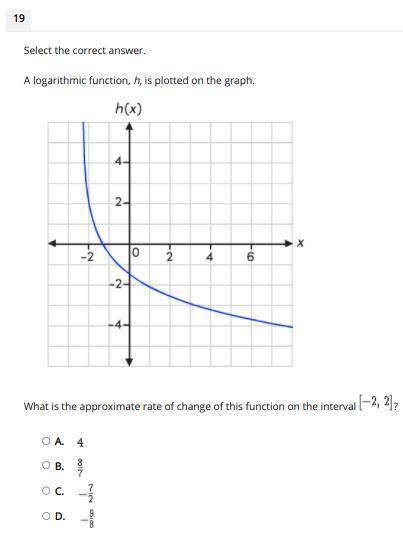
A logarithmic function, h, is plotted on the graph.
What is the approximate rate of change of this function on the interval [ -2, 2 ] ?
A. 4
B. 8/7
C. -7/2
D. -9/8

Answers: 1


Other questions on the subject: Mathematics
Mathematics, 21.06.2019 16:20, tmantooth7018
The lengths of nails produced in a factory are normally distributed with a mean of 4.91 centimeters and a standard deviation of 0.05 centimeters. find the two lengths that separate the top 4% and the bottom 4%. these lengths could serve as limits used to identify which nails should be rejected. round your answer to the nearest hundredth, if necessary.
Answers: 3
Mathematics, 21.06.2019 20:00, lorip7799ov3qr0
The total number of dental clinics total for the last 12 months was recorded
Answers: 3
Mathematics, 22.06.2019 02:00, ashiteru123
The function h (t) = -16t squared + 28t + 500 represents the height of a rock t seconds after it's propelled by a slingshot what does h (3.2) represent?
Answers: 1
Do you know the correct answer?
A logarithmic function, h, is plotted on the graph.
What is the approximate rate of change of this...
Questions in other subjects:
Mathematics, 26.08.2019 04:30


Mathematics, 26.08.2019 04:30


Mathematics, 26.08.2019 04:30


