

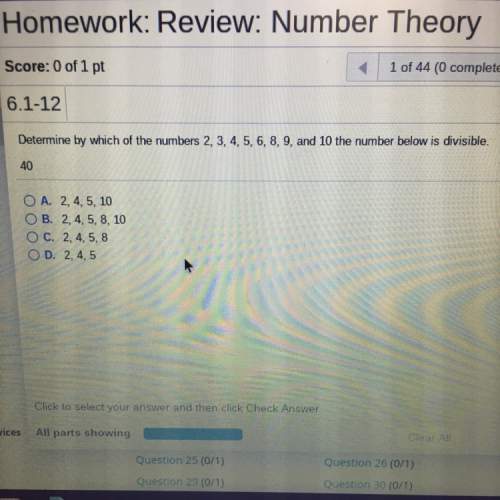
Mathematics, 20.05.2021 23:10, rschaum08
The two dot plots below show the heights of some sixth graders and some seventh graders:
Two dot plots are shown one below the other. The title for the top dot plot is Sixth Graders and the title for the bottom plot is Seventh Graders. Below the line for each dot plot is written Height followed by inches in parentheses. There are markings from 52 to 57 on the top line and the bottom line at intervals of one. For the top line there are 2 dots above the first mark, 1 dot above the second mark, 1 dot above the third mark and 2 dots above the fourth mark. For the bottom line, there is 1 dot for the first mark, there are 3 dots above the second mark, 2 dots above the third mark.
The mean absolute deviation (MAD) for the first set of data is 1.2 and the MAD for the second set of data is 0.6. Approximately how many times the variability in the heights of the seventh graders is the variability in the heights of the sixth graders? (Round all values to the tenths place.) (5 points)
0.3
1.2
1.7
2.0

Answers: 2


Other questions on the subject: Mathematics
Mathematics, 21.06.2019 18:30, rheamskeorsey33
Acoin bank containing only dimes and quarters has 12 more dimes than quarters. the total value of the coins is $11. how many quarters and dimes are in the coin bank?
Answers: 1
Mathematics, 21.06.2019 20:40, stotherow5
Describe the symmetry of the figure. identify lines of symmetry, if any. find the angle and the order of any rotational symmetry.
Answers: 1
Mathematics, 22.06.2019 03:00, jonquil201
Benjamin believes that ¼ % is equivalent to 25%. is he correct? why or why not?
Answers: 1
Do you know the correct answer?
The two dot plots below show the heights of some sixth graders and some seventh graders:
Two dot pl...
Questions in other subjects:


Physics, 01.01.2020 09:31

Social Studies, 01.01.2020 09:31

Chemistry, 01.01.2020 09:31

Geography, 01.01.2020 09:31
English, 01.01.2020 09:31
Geography, 01.01.2020 09:31

Biology, 01.01.2020 09:31


