

Mathematics, 20.05.2021 19:00, ozzie26
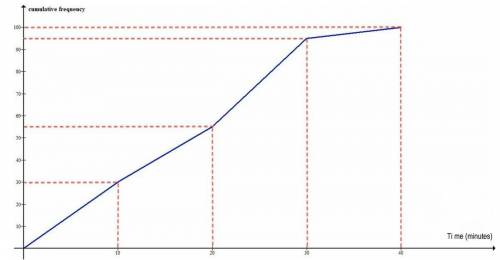
The graph shows the time at which 100 students ran 3 km. Find how many students ran this distance between 0 and 10, 10 and 20, 20 and 30 and 30 and 40 minutes. Using this grouping of the students, estimate the mean running time.

Answers: 2


Other questions on the subject: Mathematics
Mathematics, 21.06.2019 16:20, HAMILTRASHANDIKNOWIT
Giuseppi's pizza had orders for $931.00 of pizzas. the prices were $21 for a large pizza, 514 for a medium pizza, and $7 for a small pizza. the number of large pizzas was two less than four times the number of medium pizzas. thenumber of small pizzas was three more than three times the number of medium pizzas. how many of each size of pizza were ordered?
Answers: 1
Mathematics, 21.06.2019 17:00, zamudioj92p80d12
Issof claims that the scale factor is 1/2. which statement about his claim is correct
Answers: 3
Mathematics, 21.06.2019 22:30, kdtd3163
In a certain city, the hourly wage of workers on temporary employment contracts is normally distributed. the mean is $15 and the standard deviation is $3. what percentage of temporary workers earn less than $12 per hour? a. 6% b. 16% c. 26% d. 36%
Answers: 1
Do you know the correct answer?
The graph shows the time at which 100 students ran 3 km. Find how many students ran this distance be...
Questions in other subjects:

Biology, 29.01.2021 19:00


English, 29.01.2021 19:00

Mathematics, 29.01.2021 19:00
Mathematics, 29.01.2021 19:00


