


Which statement best describes this graph?
As the x-value increases by 1, the y-value
decreas...

Mathematics, 20.05.2021 18:20, avashon09
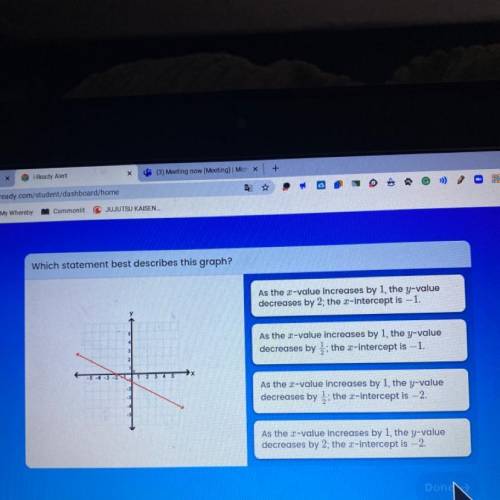
Which statement best describes this graph?
As the x-value increases by 1, the y-value
decreases by 2; the x-intercept is -1.
As the x-value increases by 1, the y-value
decreases by 3; the x-intercept is -1.
As the x-value increases by 1, the y-value
decreases by ; the x-intercept is -2.
As the x-value increases by 1, the y-value
decreases by 2; the x-intercept is -2.

Answers: 1
Other questions on the subject: Mathematics
Mathematics, 21.06.2019 18:30, 987654321156
The volume of gas a balloon can hold varies directly as the cube of its radius. imagine a balloon with a radius of 3 inches can hold 81 cubic inches of gas. how many cubic inches of gas must be released to reduce the radius down to 2 inches?
Answers: 1
Mathematics, 21.06.2019 18:30, pacerskora
Write an algebraic expression to match each statement a. four less than 8 times a number b. twice the difference of a number and six c. nine from a number squared
Answers: 1
Mathematics, 21.06.2019 20:30, violetagamez2
Answer for 10 points show work you guys in advanced < 3
Answers: 1
Do you know the correct answer?
Questions in other subjects:

English, 21.09.2019 07:50

Chemistry, 21.09.2019 07:50
Mathematics, 21.09.2019 07:50


Social Studies, 21.09.2019 07:50
Mathematics, 21.09.2019 07:50


