

Mathematics, 20.05.2021 17:10, yolomcswaggin20
7.
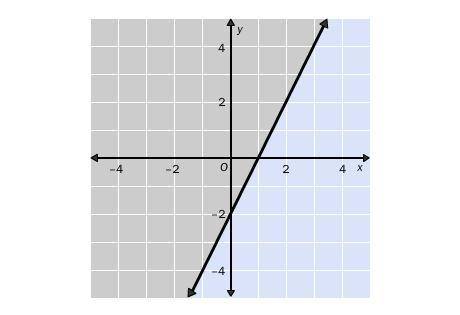
Choose the linear inequality that describes the graph. The gray area represents the shaded region.
A. y ≥ 2x – 2
B. y ≥ 2x + 2
C. y ≥ –2x + 2
D. y ≤ 2x – 2

Answers: 1


Other questions on the subject: Mathematics
Mathematics, 21.06.2019 12:30, 101EXPERIENCE
Iam so stuck. what is the worked out answer for this question?
Answers: 1
Mathematics, 21.06.2019 16:30, alexcuevaz90
Why do interests rates on loans to be lower in a weak economy than in a strong one
Answers: 3
Do you know the correct answer?
7.
Choose the linear inequality that describes the graph. The gray area represents the shaded regio...
Questions in other subjects:

Computers and Technology, 16.04.2021 17:20


Mathematics, 16.04.2021 17:20


