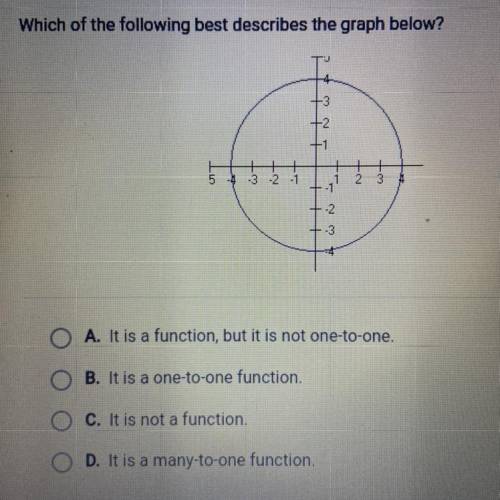
Which of the following best describes the graph below?
N+
5
-4
-3 -2 -1
1
- 1
3
-2
-3
O A. It is a function, but it is not one-to-one.
B. It is a one-to-one function.
O C. It is not a function.
OD. It is a many-to-one function.
Which of the following describes how to translate the graph y = xi to obtain the graph of y = x - 11 - 12 1 unit left and 1 unit down 1 unit left and 1 unit up 1 unit right and 1 unit down 1 unit right and 1 unit up
Diane’s bank is offering 5% interest, compounded monthly. if diane invests $10,500 and wants $20,000 when she withdrawals, how long should she keep her money in for? round to the nearest tenth of a year.
Two cars which are 40 miles apart start moving simultaneously in the same direction with constant speeds. if the speed of the car which is behind is 56 mph and the speed of the other car is 48 mph, how many hours will it take for the car which is behind to catch up the car ahead of it?