

Mathematics, 19.05.2021 22:20, timttimtim
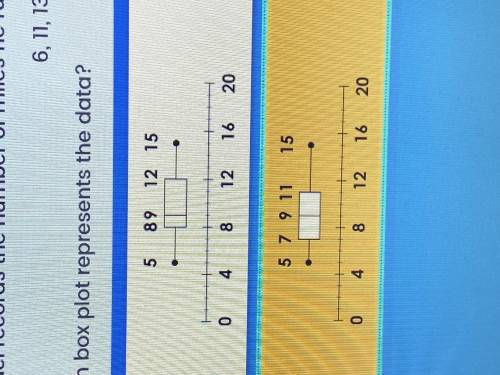
Michael records the number of miles he runs each week for nine weeks. 6, 11, 13, 8, 15, 9, 11, 5, 9 Which box plot represents the data?

Answers: 1


Other questions on the subject: Mathematics
Mathematics, 21.06.2019 12:30, krystinayagel013
Trevor and marissa together have 26 t-shirts to sell. if marissa has 6 fewer tshirts that trevor, find hiw many tshirts trevor has. identify the if-than moves in your solution
Answers: 1
Mathematics, 21.06.2019 20:30, sterlingrobinson35
Someone answer asap for ! a ball is rolled down a ramp. the height, f(x), in meters, of the ball x seconds after it is released is modeled by the function f(x) = x²- 10x + 25 for all values of x from 0 to 5. which statement about the ball is true? a. the maximum height of the ball is 5 meters b. the height of the ball increases from 0 to 5 meters above the ground. c. the ball has traveled 5 meters when it reaches the bottom of the ramp. d. the ball has been traveling for 5 seconds when it reaches the bottom of the ramp
Answers: 1
Do you know the correct answer?
Michael records the number of miles he runs each week for nine weeks. 6, 11, 13, 8, 15, 9, 11, 5, 9...
Questions in other subjects:


Mathematics, 19.02.2020 06:03


