


These box plots show daily low temperatures for a sample of days in two
different towns.
Town...

Mathematics, 19.05.2021 19:00, oliup567
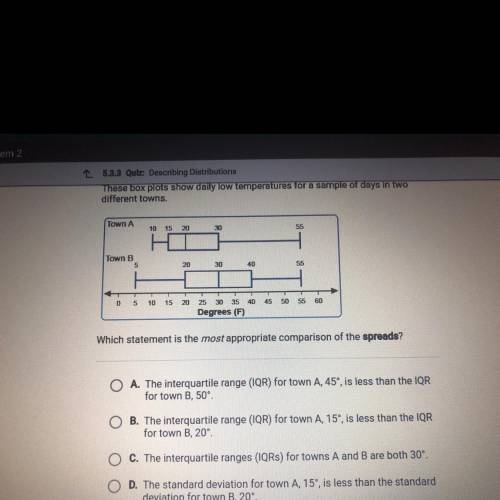
These box plots show daily low temperatures for a sample of days in two
different towns.
Town A
10
15
20
30
55
Town B
5
20
30
40
55
0
th
10
15
20
45
50
55
60
25 30 35 40
Degrees (F)
Which statement is the most appropriate comparison of the spreads?
O A. The interquartile range (IQR) for town A, 45°, is less than the IQR
for town B, 50°
O B. The interquartile range (IQR) for town A, 15°, is less than the IQR
for town B, 20°
O C. The interquartile ranges (IQRs) for towns A and B are both 30°.
O D. The standard deviation for town A, 15", is less than the standard
deviation for town B 20°

Answers: 2
Other questions on the subject: Mathematics
Mathematics, 21.06.2019 16:30, trentonmccary2096
Consider 6x2 + 6x + 1. which term immediately tells you that this expression is not a perfect square trinomial? justify your answer
Answers: 2
Mathematics, 21.06.2019 17:00, tessadummer0033
What is a graph with a never ending line called?
Answers: 1
Mathematics, 22.06.2019 02:30, ladypink94
P= price tax is 4% added to the price. which expression shows the total price including tax?
Answers: 3
Do you know the correct answer?
Questions in other subjects:


History, 30.11.2020 22:10
Biology, 30.11.2020 22:10


