


This Venn diagram shows sports played by 10 students.
PLAYS SOCCER.
(2 students)
MIDDL...

Mathematics, 18.05.2021 19:30, jwyapo4
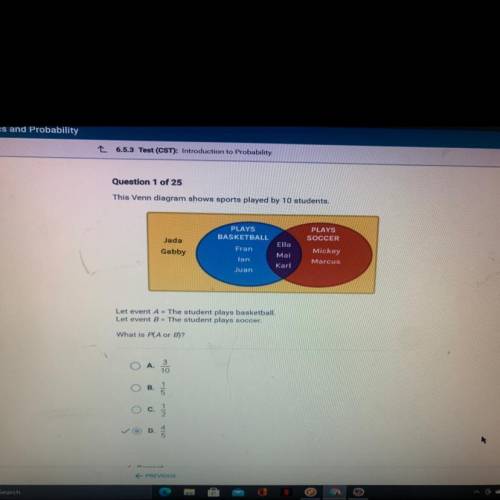
This Venn diagram shows sports played by 10 students.
PLAYS SOCCER.
(2 students)
MIDDLE
(3 students)
PLAYS BASKETBALL
(2 students)
Let event A = The student plays basketball.
Let event B = The student plays soccer
What is PA or B)?
The answer would be 4/5. Just make sure you have the same amount of students in the category.

Answers: 3
Other questions on the subject: Mathematics
Mathematics, 21.06.2019 15:30, juli8350
The average hourly earnings for a construction worker is projected to be $24.50 in 2012. jason wants to join the construction work force after he graduates in 2012. his friend tells him that average hourly earnings for construction workers will rise by 2% from 2009 to 2012. based on the data below, assuming that the projected hourly earnings are correct, is jason’s friend’s statement accurate? construction industry - average hourly earnings, 2000-2009 a. his friend’s statement is accurate. the average hourly earnings will increase by 2%. b. his friend’s statement is not accurate. the percent increase will be more than 2% c. his friend’s statement is not accurate. the percent increase will be less than 2% d. his friend’s statement is not accurate. the average hourly earnings will decrease
Answers: 3
Mathematics, 21.06.2019 22:20, anicholson41
Question 9 of 10 2 points suppose your sat score is 1770. you look up the average sat scores for students admitted to your preferred colleges and find the list of scores below. based on your sat score of 1770, which average score below represents the college that would be your best option? o a. 1790 o b. 2130 o c. 2210 od. 1350
Answers: 3
Do you know the correct answer?
Questions in other subjects:

Mathematics, 24.06.2019 14:00
Mathematics, 24.06.2019 14:00

Mathematics, 24.06.2019 14:00

Mathematics, 24.06.2019 14:00


