


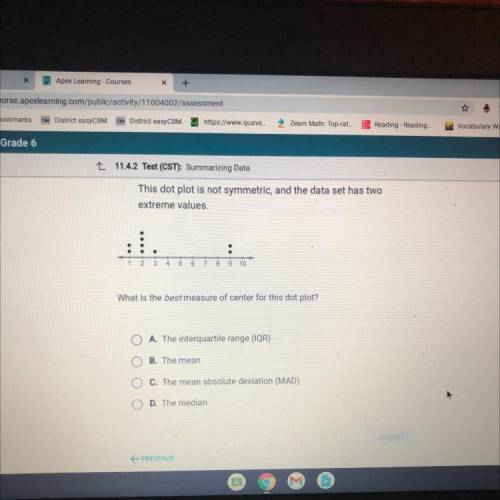
This dot plot is not symmetric, and the data set has two
extreme values.
1 2 3 4
6 7 8...

Mathematics, 17.05.2021 17:40, juliannabartra
This dot plot is not symmetric, and the data set has two
extreme values.
1 2 3 4
6 7 8 9 10
What is the best measure of center for this dot plot?
O A. The interquartile range (IQR)
O B. The mean
O C. The mean absolute deviation (MAD)
O D. The median

Answers: 2
Other questions on the subject: Mathematics
Mathematics, 21.06.2019 14:30, mia2286
Chandler was a caretaker at the state zoo. he noticed that the number of animals adopted by the zoo increased at a constant rate every year since 2010. which of the following graphs shows the slowest rate at which the animals in the zoo were adopted?
Answers: 2
Mathematics, 21.06.2019 18:50, casianogabriel2004
Which expression shows the sum of the polynomials with like terms grouped together
Answers: 2
Mathematics, 21.06.2019 22:00, sherman55
(05.03 mc) part a: explain why the x-coordinates of the points where the graphs of the equations y = 4x and y = 2x−2 intersect are the solutions of the equation 4x = 2x−2. (4 points) part b: make tables to find the solution to 4x = 2x−2. take the integer values of x between −3 and 3. (4 points) part c: how can you solve the equation 4x = 2x−2 graphically? (2 points)
Answers: 1
Do you know the correct answer?
Questions in other subjects:

Social Studies, 24.12.2019 20:31


