

Mathematics, 14.05.2021 07:20, idk7193
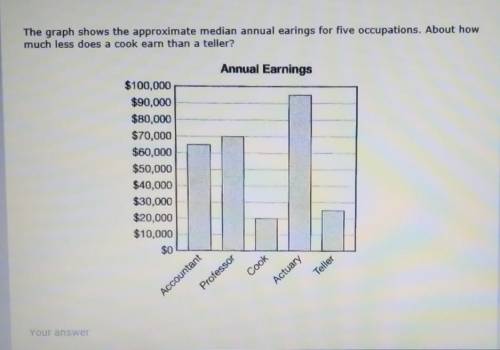
The graph shows the approximate median annual earings for five occupations. About how much less does a cook earn than a teller? Annual Earnings $100,000 $90,000 $80,000 $70,000 $60,000 $50,000 $40,000 $30,000 $20,000 $10,000 $0 Cook Teller Professor Actuary Accountant PLs help

Answers: 1


Other questions on the subject: Mathematics
Mathematics, 21.06.2019 17:10, tdahna0403
The graph of g(x) is a translation of y = which equation represents g(x)?
Answers: 1
Mathematics, 21.06.2019 20:00, JOEFRESH10
The table shows the age and finish time of ten runners in a half marathon. identify the outlier in this data set. drag into the table the ordered pair of the outlier and a reason why that point is an outlier.
Answers: 1
Do you know the correct answer?
The graph shows the approximate median annual earings for five occupations. About how much less does...
Questions in other subjects:
Mathematics, 27.11.2019 04:31


Mathematics, 27.11.2019 04:31


