


What is the best description of the data?
Height Tally Frequency
65" | 1
66" | 1
...

Mathematics, 13.05.2021 21:20, pk4mk
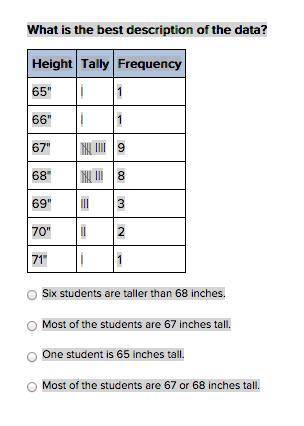
What is the best description of the data?
Height Tally Frequency
65" | 1
66" | 1
67" | 9
68" ||| 8
69" ||| 3
70" || 2
71" | 1
Six students are taller than 68 inches.
Most of the students are 67 inches tall.
One student is 65 inches tall.
Most of the students are 67 or 68 inches tall.

Answers: 1
Other questions on the subject: Mathematics
Mathematics, 21.06.2019 20:30, ChefCurtis
Adecorative window is made up of a rectangle with semicircles at either end. the ratio of ad to ab is 3: 2 and ab is 30 inches. what is the ratio of the area of the rectangle to the combined area of the semicircles? possible answers: a. 2: 3 b. 3: 2 c. 6: π d. 9: π e. 30: π
Answers: 1
Mathematics, 22.06.2019 00:00, jhenifelix
Cd is the perpendicular bisector of both xy and st, and cy=20. find xy.
Answers: 1
Do you know the correct answer?
Questions in other subjects:


Geography, 24.09.2020 08:01


