

Mathematics, 13.05.2021 19:20, jarvinmcgillp3dhni
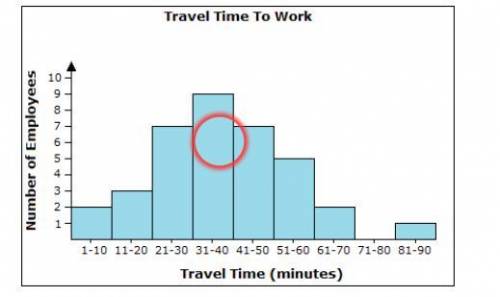
The manager of a company surveyed his employees to determine how long it takes them to travel to work each morning. The results are shown in the histogram.
Which statement correctly describes the data?
A.
More employees travel between 11 and 30 minutes than those who travel between 31 and 50 minutes.
B.
Fewer employees travel between 1 and 20 minutes than those who travel between 61 and 90 minutes.
C.
More than half of the employees travel between 1 and 40 minutes.
D.
There are 24 employees who travel between 21 and 50 minutes.

Answers: 2


Other questions on the subject: Mathematics
Mathematics, 21.06.2019 18:20, vic2nvsty
Alana has 12.5 cups of flour with which she is baking four loaves of raisin bread and one large pretzel. the pretzel requires 2.5 cups of flour to make. how much flour is in each loaf of raisin bread? explain the steps to follow to get the answer.
Answers: 3
Do you know the correct answer?
The manager of a company surveyed his employees to determine how long it takes them to travel to wor...
Questions in other subjects:


Mathematics, 19.05.2020 23:47

Physics, 19.05.2020 23:47

Chemistry, 19.05.2020 23:47

Social Studies, 19.05.2020 23:47


