

Mathematics, 13.05.2021 02:50, sherlock19
The Sine Function
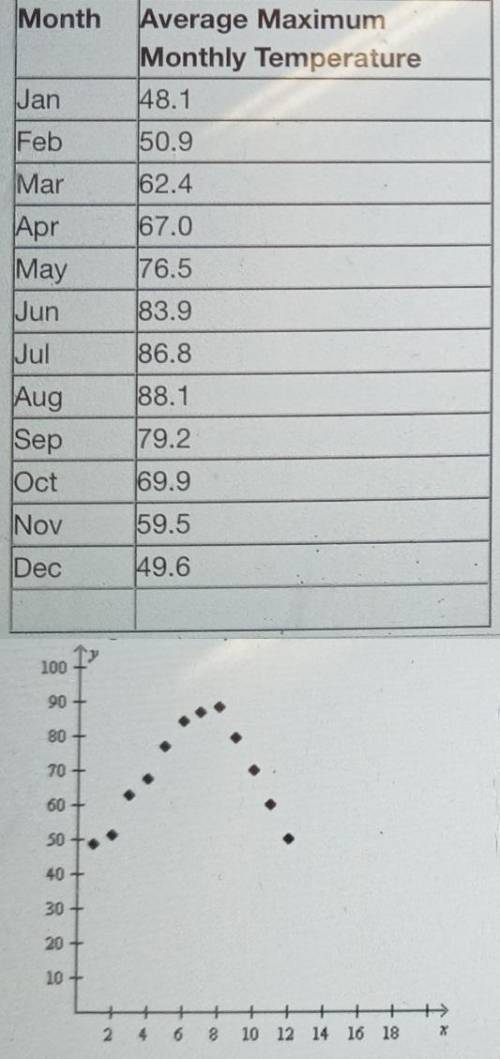
According to the National Weather Service, the average monthly high temperature in the Dallas/Fort Worth, Texas area from the years of 2006-2008 is given by the following table:
To get a feel for the relationship between the month and the average high temperatures, the data is plotted on the following scatter plot.
If the plot was extended to a two year period with 1 = Jan of the first year, 12 = Dec of the first year, 13 = Jan of the second year, 24 = Dec of the second year, describe the plot with the additional information.
a. Linear
b. Random dots
c. Wave-like and repetitive
d. Quadratic
Please select the best answer from the choices provided

Answers: 2


Other questions on the subject: Mathematics
Mathematics, 21.06.2019 21:00, ayoismeisalex
Me! i will mark brainliest! i don't get polynomials and all that other stuff. so this question is really hard. multiply and simplify.(x - 4) (x^2 – 5x – 6)show your
Answers: 2
Mathematics, 22.06.2019 00:30, angelyce4142
How can you check that you have correctly converted frequencies to relative frequencies?
Answers: 1
Do you know the correct answer?
The Sine Function
According to the National Weather Service, the average monthly high temperature i...
Questions in other subjects:

Biology, 07.05.2020 07:02
Mathematics, 07.05.2020 07:02

Geography, 07.05.2020 07:02


Social Studies, 07.05.2020 07:02


