

Mathematics, 12.05.2021 19:20, avastanleyy
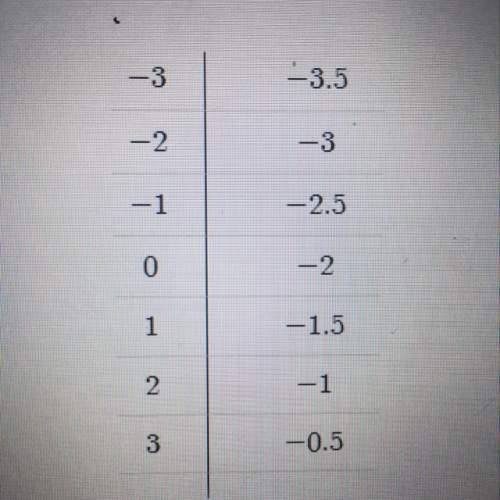
These tables represent a quadratic function with a vertex at (0,3). What is the
average rate of change for the interval from x = 7 to x = 8?
х
Interval
0
1
2
у
3
2
-1
-6
-13
--22
--33
Average rate
of change
-1
1-2
-3
1-2
-5
1-2
-7
]-2
-9
13-2
-11
O to 1
1 to 2
2 to 3
3 to 4
4 to 5
5 to 6
3
4
5
6
O
A. -15
B. -61
C.-2
D. -46

Answers: 3


Other questions on the subject: Mathematics
Mathematics, 21.06.2019 16:30, andybiersack154
If 20% of a number is 35, what is 50% of that number?
Answers: 2
Mathematics, 21.06.2019 20:00, Ap621765
In one day there are too high tides into low tides and equally spaced intervals the high tide is observed to be 6 feet above the average sea level after six hours passed a low tide occurs at 6 feet below the average sea level in this task you will model this occurrence using a trigonometric function by using x as a measurement of time assume the first high tide occurs at x=0. a. what are the independent and dependent variables? b. determine these key features of the function that models the tide: 1.amplitude 2.period 3.frequency 4.midline 5.vertical shift 6.phase shift c. create a trigonometric function that models the ocean tide for a period of 12 hours. d. what is the height of the tide after 93 hours?
Answers: 1
Do you know the correct answer?
These tables represent a quadratic function with a vertex at (0,3). What is the
average rate of cha...
Questions in other subjects:

Geography, 09.06.2020 11:57

History, 09.06.2020 11:57

History, 09.06.2020 11:57

Mathematics, 09.06.2020 11:57

Biology, 09.06.2020 11:57
Mathematics, 09.06.2020 11:57


