

Mathematics, 12.05.2021 03:10, AyeSmoky
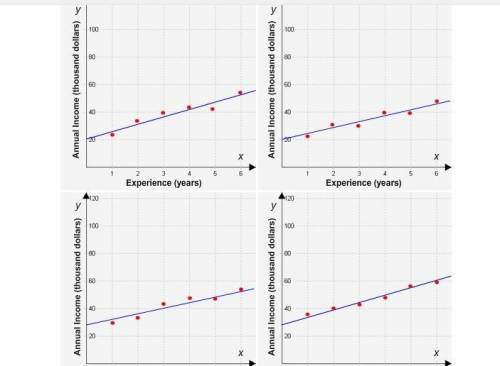
Select the correct graph. When David first got a job, his annual income was $20,000. He worked hard and got more experience. After 8 years, he realized that his average increase in pay was about $4,000 every year. Which scatter plot represents this situation?

Answers: 2


Other questions on the subject: Mathematics
Mathematics, 21.06.2019 13:20, areanna02
Which equation and solution can be used to solve this problem? thirteen less than a number is sixteen. 13-n=16: add 13 to both sides. the answer is 29. n+13=16: subtract 13 from both sides. the answer is 3. n+16=13 subtract 13 from both sides. the answer is 3. n-13=16: add 13 to both sides. the answer is 29.
Answers: 1
Mathematics, 21.06.2019 15:30, nsuleban9524
Astore manager records the total visitors and sales, in dollars, for 10 days. the data is shown in the scatter plot. what conclusion can the store manager draw based on the data? question 3 options: an increase in sales causes a decrease in visitors. an increase in sales is correlated with a decrease in visitors. an increase in visitors is correlated with an increase in sales.
Answers: 1
Do you know the correct answer?
Select the correct graph.
When David first got a job, his annual income was $20,000. He worked hard...
Questions in other subjects:
Mathematics, 19.10.2021 21:40

Mathematics, 19.10.2021 21:40

Advanced Placement (AP), 19.10.2021 21:40


Chemistry, 19.10.2021 21:40

Mathematics, 19.10.2021 21:40


