

Mathematics, 12.05.2021 01:00, luisannavasquez6129
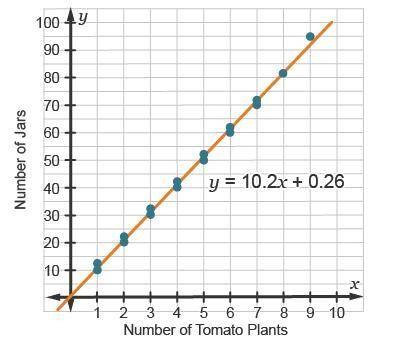
The data reflects the number of tomato plants planted (x), paired with the number of jars of canned tomatoes (y).
A graph has number of tomato plants on the x-axis and number of jars on the y-axis. A line of best fit has equation y = 10.2 x + 0.26.
How can the slope of the line be interpreted?
Every additional tomato plant yields an additional 10.2 jars of canned tomatoes.
Every additional tomato plant yields an additional 0.26 jars of canned tomatoes.
Each jar of canned tomatoes requires 10.2 tomato plants.
Each jar of canned tomatoes requires 0.26 tomato plants.

Answers: 3


Other questions on the subject: Mathematics
Mathematics, 22.06.2019 02:00, 4presidents
Arectangular yard has area 96 square feet. if the width of the yard is 4 feet less than the length
Answers: 1
Mathematics, 22.06.2019 04:30, littledudefromacross
Three lines meet at a point. set up and solve an equation to find the value of (a) is your answer reasonable? explain how you know
Answers: 3
Do you know the correct answer?
The data reflects the number of tomato plants planted (x), paired with the number of jars of canned...
Questions in other subjects:
Mathematics, 16.12.2019 12:31


Biology, 16.12.2019 12:31


Computers and Technology, 16.12.2019 12:31
English, 16.12.2019 12:31
Mathematics, 16.12.2019 12:31


