he used the algebra tiles correctly.
step-by-step explanation:
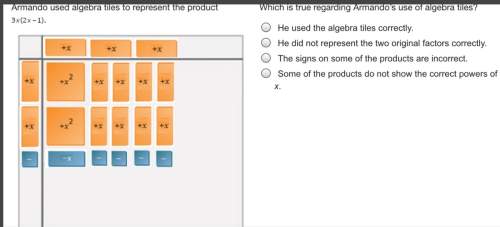
given : 3x(2x-1)
solution :
since he used algebra tiles .
armando's solution is the same in the solution shown in figure
as he distributed 2x into x and x and wrote them vertically
and also write -1 vertically
and 3x into x and x and x and wrote it horizontally
performing the multiplication in the algebra tiles we get 
and solving the given expression :
3x(2x-1)
since solving the expression using tiles and solving the expression algebraically we get the same answer
thus we can choose the first statement as the answer to this problem which is "he used the algebra tiles correctly".