


Tony collected data on the years of
employment and the annual salaries of the
salespeople at...

Mathematics, 10.05.2021 22:00, bullockarwen
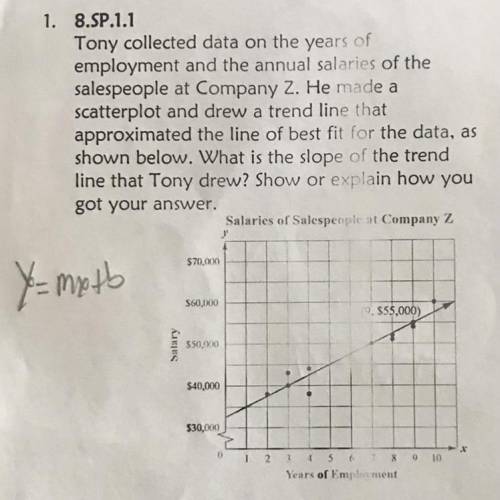
Tony collected data on the years of
employment and the annual salaries of the
salespeople at Company Z. He made a
scatterplot and drew a trend line that
approximated the line of best fit for the data, as
shown below. What is the slope of the trend
line that Tony drew? Show or explain how you
got your answer.
Salaries of Salespeople at Company Z

Answers: 3
Other questions on the subject: Mathematics
Mathematics, 21.06.2019 16:30, SkyeShadow525
The length of the largest fish is 967.74 times greater than the length of the smallest fish. select a variable expression that shows the length of the largest fish, if 8 is the length of the smallest fish. a. s + 967.74 b. \[ \frac{967.74}{s} \] c. 967.74 - s d. 967. 74s
Answers: 1
Mathematics, 21.06.2019 17:00, bhebert6057
Cameron indoor stadium at duke university is one of the most revered sites in all of college basketball, as well as in all of sports period. duke’s men’s and women’s basketball programs have attained quite a few wins in the building over the last seventy years. cameron indoor stadium is capable of seating 9,460 people. for each game, the amount of money that the duke blue devils’ athletic program brings in as revenue is a function of the number of people in attendance. if each ticket costs $45.50, find the domain and range of this function.
Answers: 1
Mathematics, 21.06.2019 18:10, jaimejohnston2
What is the ratio for the surface areas of the cones shown below, given that they are similar and that the ratio of their radil and altitudes is 4: 3? 23
Answers: 1
Do you know the correct answer?
Questions in other subjects:

History, 17.07.2020 20:01


