

Mathematics, 10.05.2021 21:10, ToriChristine
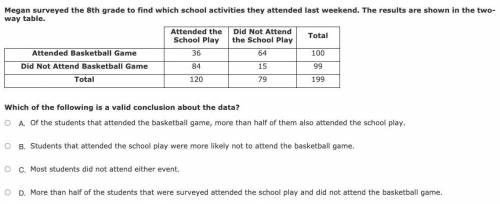
Megan surveyed the 8th grade to find which school activities they attended last weekend. The results are shown in the two-way table. Which of the following is a valid conclusion about the data? (Don't ask why it says college, this is actually middle school work)

Answers: 3


Other questions on the subject: Mathematics
Mathematics, 22.06.2019 00:30, aleilyg2005
Two corresponding sides of two similar triangles are 3cm and 5cm. the area of the first triangle is 12cm2. what is the area of the second triangle?
Answers: 2
Mathematics, 22.06.2019 01:30, cpulls189
Cherie works in retail and her weekly salary includes commission for the amount she sells. the equation s=400+0.15c models the relation between her weekly salary, s, in dollars and the amount of her sales, c, in dollars. interpret the slope of the equation.
Answers: 3
Mathematics, 22.06.2019 02:10, netflixacc0107
The human resources manager at a company records the length, in hours, of one shift at work, x. he creates the probability distribution below. what is the probability that a worker chosen at random works at least 8 hours? 0.62 0.78 0.84 0.96
Answers: 2
Mathematics, 22.06.2019 03:30, tracyaleblanc
The area of a square floor on a scale drawing is 64 square centimeters, and the scale drawing is 1 centimeter: 3 ft. what is the area of the actual floor? what is the ratio of the area in the drawing to the actual area? the area of the actual floor is square feet. the ratio of the area in the drawing to the actual area is 1 square centimeter: square feet.
Answers: 3
Do you know the correct answer?
Megan surveyed the 8th grade to find which school activities they attended last weekend. The results...
Questions in other subjects:

Business, 14.07.2020 20:01


