


Question 15 Multiple Choice Worth 1 points)
(05.06)
A graph is shown below.
Whic...

Mathematics, 10.05.2021 20:40, Zhodges5020
Question 15 Multiple Choice Worth 1 points)
(05.06)
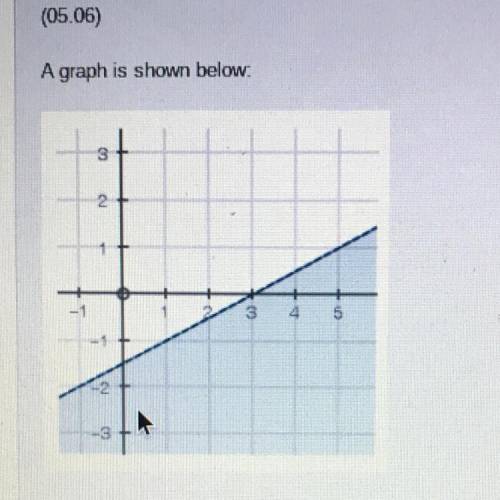
A graph is shown below.
Which of the following inequalities is best represented by this graph?
A. x-2y > 3
B. x - 2y < 3
C.2x - y > 3
D.2x - y <3

Answers: 2
Other questions on the subject: Mathematics
Mathematics, 21.06.2019 20:30, ElegantEmerald
A. plot the data for the functions f(x) and g(x) on a grid and connect the points. x -2 -1 0 1 2 f(x) 1/9 1/3 1 3 9 x -2 -1 0 1 2 g(x) -4 -2 0 2 4 b. which function could be described as exponential and which as linear? explain. c. if the functions continue with the same pattern, will the function values ever be equal? if so, give estimates for the value of x that will make the function values equals. if not, explain why the function values will never be equal.
Answers: 3
Mathematics, 21.06.2019 22:00, jessejames48
The coordinates r(1, -3), s(3, -1) t(5, -7) form what type of polygon? a right triangle an acute triangle an equilateral triangle an obtuse triangle
Answers: 1
Do you know the correct answer?
Questions in other subjects:

Biology, 02.01.2021 14:00

Chemistry, 02.01.2021 14:00

Health, 02.01.2021 14:00

Advanced Placement (AP), 02.01.2021 14:00
Biology, 02.01.2021 14:00
Mathematics, 02.01.2021 14:00
Mathematics, 02.01.2021 14:00
Chemistry, 02.01.2021 14:00


