

Mathematics, 10.05.2021 20:40, lin550
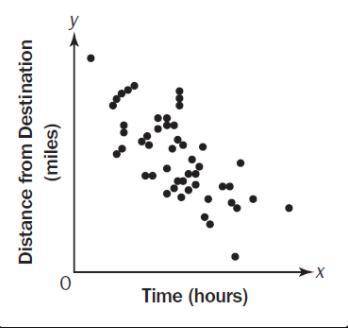
The scatter plot suggests a relationship between time and the distance from the destination. The equation of the line of best fit is y=-0.6x+15, and the correlation coefficient is -0.8. Which best describes the correlation between the two variables?
a. weak positive
b. strong positive
c. weak negative
d. strong negative

Answers: 3


Other questions on the subject: Mathematics
Mathematics, 21.06.2019 15:20, heyrosaphoto3159
The speed of a falling object increases at a constant rate as time increases since the object was dropped. which graph could represent the relationship betweent time in seconds, and s, speed in meters per second? speed of a falling object object over time
Answers: 1
Mathematics, 21.06.2019 20:00, jortizven0001
Seymour is twice as old as cassandra. if 16 is added to cassandra’s age and 16 is subtracted from seymour’s age, their ages become equal. what are their present ages? show !
Answers: 1
Mathematics, 21.06.2019 21:30, jarviantemelton
Consider the following equation. 1/2x^3+x-7=-3sqrtx-1 approximate the solution to the equation using three iterations of successive approximation. use the graph below as a starting point. a. b. c. d.
Answers: 3
Do you know the correct answer?
The scatter plot suggests a relationship between time and the distance from the destination. The equ...
Questions in other subjects:


Mathematics, 25.03.2020 22:30


Physics, 25.03.2020 22:30
Mathematics, 25.03.2020 22:30


