

Mathematics, 10.05.2021 18:30, xojade
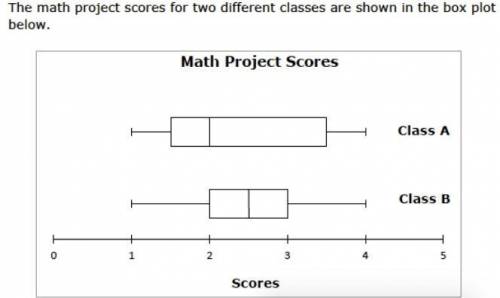
The math project scores for two different classes are shown in the box plot below.
(the picture)
Which statement about Class A and Class B math project scores is NOT supported by the graph?
A) The range of scores for both classes is 3.
B) The interquartile range for Class A is greater than the interquartile range for Class B.
C) The interquartile range for Class B is 2.
D) The median score for Class B is 0.5 greater than the median score for Class A.

Answers: 3


Other questions on the subject: Mathematics
Mathematics, 21.06.2019 19:00, cathyfrawley
Thee blue triangle has rotated from quadrant i to quadrant iii about the origin. describe the effects of the rotation on the coordinates of the blue triangle.
Answers: 3
Mathematics, 21.06.2019 19:30, mariaaaaa69
Complete the solution of the equation. find the value of y when x equals to 28 x+3y=28
Answers: 2
Mathematics, 21.06.2019 19:30, danielahchf
Ineed with angles and the measure of them i have abc a is 65 and b is (3x-10) and c is (2x) find the value of x
Answers: 2
Do you know the correct answer?
The math project scores for two different classes are shown in the box plot below.
(the picture)
Questions in other subjects:


